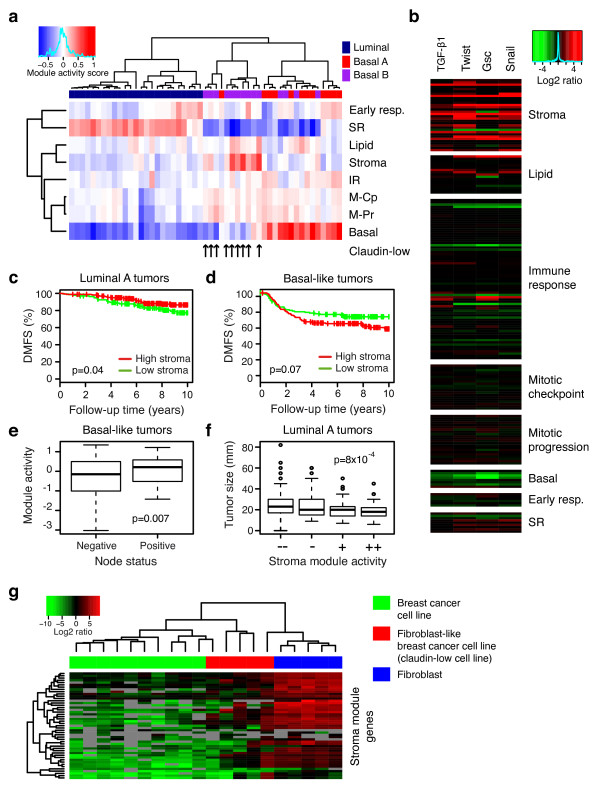
Figure 3.
The stroma module represents mesenchymal cell characteristics. (a) Hierarchical clustering of module activity scores, calculated in data representing 51 breast cancer cell lines, showed separation into the main cell line types: luminal, basal A and basal B [50]. Black arrows denote cell lines characterized as representing a claudin-low phenotype [51]. M-Pr, mitotic progression; M-Cp, mitotic checkpoint. (b) Expression of EMT-inducing factors increases expression of genes from the stroma module. Data for the 187 module genes from a dataset representing overexpression of TGF-beta1, Twist, Gsc or Snail in immortalized breast fibroblasts were visualized using heatmaps. Data are shown as fold changes in relation to mock transfection control. (c) A high stroma module activity score correlates to a more favorable prognosis in patients of the luminal A subtype (P = 0.04, log-rank test), whereas (d) an opposite trend was observed for patients with tumors of the basal-like subtype (P = 0.07, log-rank test). Patients were dichotomized based on a stroma module activity score above or below mean within each subtype. (e) Within the basal-like classified patients a high stroma module activity score correlated to node-positive disease (P = 0.007, t-test). (f) Within the luminal A classified patients a higher stroma module activity score, quantized into four groups, correlated to a smaller tumor size (P = 8*10-4, ANOVA). (g) Hierarchical clustering of primary breast fibroblasts, fibroblast-like (claudin-low) breast cancer cell lines, and breast cancer cell lines, based on expression of genes in the stroma module. Data from GSE13915 [54].

