Figure 3.
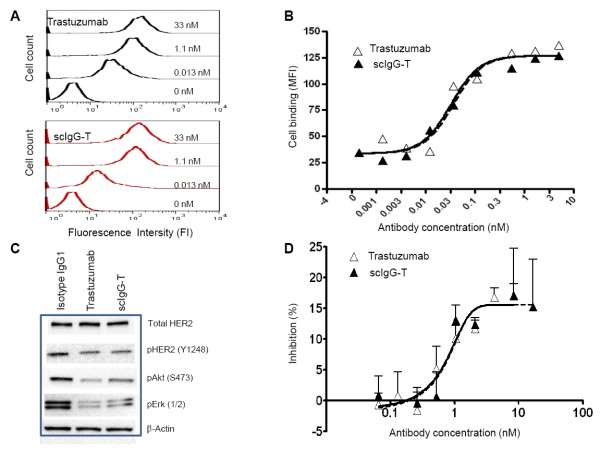
Biological characterization of single hinge cleaved trastuzumab compared with the intact trastuzumab antibody in vitro. (A) Histograms of trastuzumab and single hinge cleaved trastuzumab (scIgG-T) binding to HER2 expressed on BT474 cells using a flow cytometer. (B) Concentration-dependent binding of trastuzumab and scIgG-T to HER2 expressed on BT474 breast cancer cells as measured by flow cytometer. Mean fluorescence intensity (MFI) is plotted against each antibody concentration (nM) on the x axis. (C) Effect of trastuzumab and scIgG-T on total HER2 expression, pHER2 (Y1289), pAKT (S473), and pErk1/2 in BT474 cells as determined by western blotting. (D) Inhibition of BT474 breast cancer cell proliferation by trastuzumab and scIgG-T (n = 4). Percentage of cell growth inhibition calculated as: (fluorescence signal of control group - signal of treatment group)/signal of control group×100.

