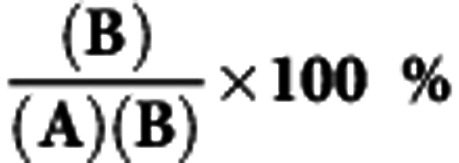
Table 5. A comparison of different screening policies for 1 million women during 12 years.
| Screening policies | Number of Screening | Incident screen-detected cases (A) | Interval cancers (B) |
Interval cancers proportion

|
I/E ratio |
|---|---|---|---|---|---|
| Universal | |||||
| Annual | 12 895 635 | 11 444 | 2989 | 20.71 | 0.14 |
| Biennial | 6 947 795 | 9344 | 5089 | 35.26 | 0.23 |
| Triennial |
4 964 306 |
7739 |
6694 |
46.38 |
0.30 |
| Risk-score-based approach | 7 297 357 | 9017 | 4670 | 34.12 | 0.21 |
