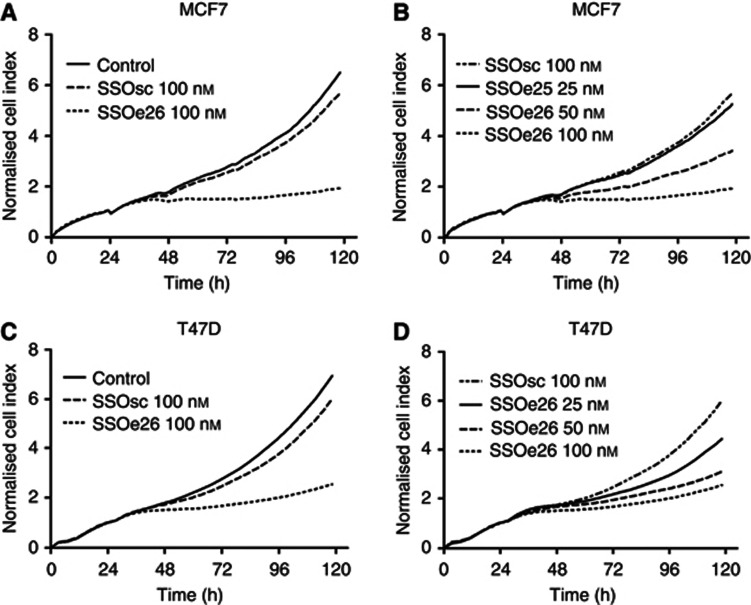
Figure 3.
Growth inhibition of MCF7 and T47D cells by SSOe26 treatment. Proliferation was measured as the cell index using a Real-Time Cell Analyzer (RTCA) station. (A) MCF7 cells were treated with fresh media containing transfection reagent (control) or SSOe26 (100 nℳ) or SSOsc (100 nℳ) formulated with transfection reagent. Shown are the mean of triplicates. (B) Growth inhibition of MCF7 cells by increasing concentrations of SSOe26. Cells were treated with 25, 50 and 100 nℳ SSOe26 or 100 nℳ of SSOsc as indicated. Shown are the mean of triplicates. (C) T47D cells were treated with fresh media containing transfection reagent (control) or SSOe26 (100 nℳ) or SSOsc (100 nℳ) formulated with transfection reagent. Shown are the mean of triplicates. (D) Growth inhibition of T47D cells by increasing concentrations of SSOe26. Cells were treated with 25, 50 and 100 nℳ SSOe26 or 100 nℳ of SSOsc as indicated. Shown are the mean of triplicates.

