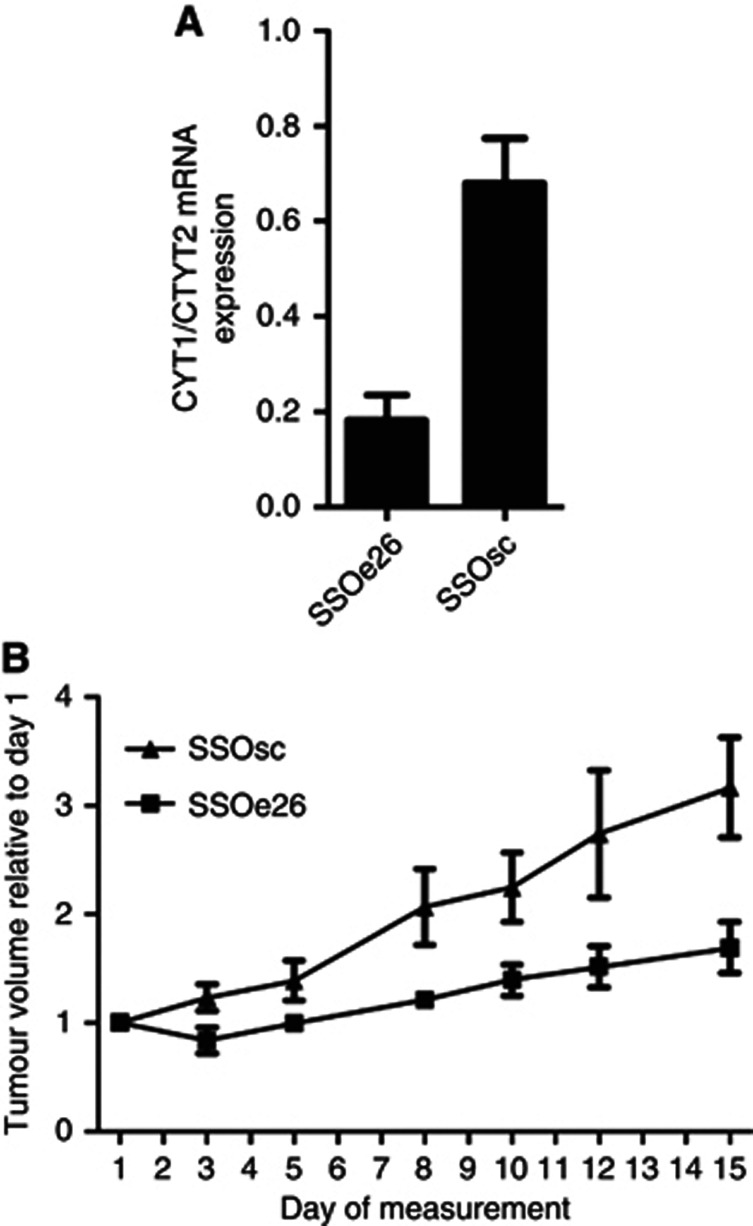
Figure 5.
Tumour growth of a xenograft mouse model. Mice received 400 μg of SSOe26 or SSOsc intraperitoneally three times per week for 15 days. (A) The mRNA expression ratio of CYT1 and CYT2 in tumours removed from mice treated with SSOe26 or SSOsc as indicated. Shown are mean of six mice and error bars indicate s.e.m. (B) The tumour size was manually measured three times per week for 15 days. Size was calculated as ½ × (length × with2). Shown are mean of six mice. Error bars indicate s.e.m.

