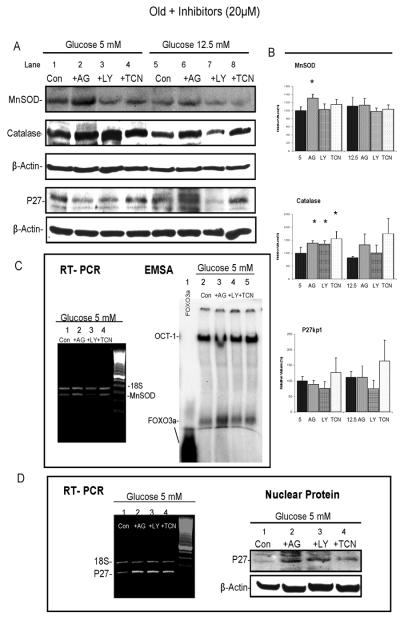
Fig. 7. Effect of kinase inhibitors on MnSOD, catalase and p27.
VSMC from three old rats were sub-cultured overnight and on the second day, cells were pre-treated with 20μM of AG1024, LY294002, or TCN for 30 min and then grown for 3 days in medium containing 5 mM or 12.5 mM glucose with 20 μM of each inhibitor, respectively. A. Examples of Western blots showing MnSOD and catalase in cytoplasmic protein and p27 in total protein. Each includes the same blot with β-actin as a loading control. B. Changes of MnSOD, catalase and p27 in AG1024-, LY294002-, and TCN-treated cells summarized as a percentage of 5 mM glucose control (mean ± SE, n=3). p values are for comparisons between the cells treated with inhibitors in 5 mM glucose or 12.5 mM glucose medium vs. their corresponding controls, and * indicates p ≤ 0.05. C. On the left is an example of quantitative-RT-PCR showing dual amplification of MnSOD and 18S RNA bands from a set of VSMC grown in 5 mM glucose medium with or without inhibitors. On the right, an EMSA result shows the corresponding activity of FOXO3a binding to MnSOD detected by radioactively-labeled MnSOD-DBE probe. In addition, an OCT-1 consensus was used as an internal loading control, and binding between the 100-residue of the FOXO3a peptide and MnSOD-DBE probe is included in lane 1. D. On the left, an example of quantitative-RT-PCR showing dual amplification of p27 and 18S RNA bands from a set of VSMC grown in 5 mM glucose medium with or without inhibitors. On the right, an example of a Western blots shows changes of p27 protein in the nucleus of VSMC grown in 5 mM glucose with inhibitors.

