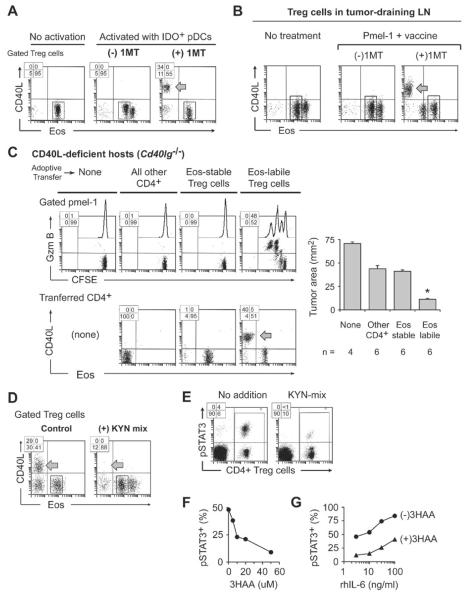
Figure 7. IDO blocks Eos down-regulation.
(A) Plasmacytoid DCs (pDCs) with high IDO expression were obtained by sorting CD11c+ cells from TDLNs of mice with B16F10 tumors, and used in reprogramming co-cultures with resting Foxp3GFP Treg cells (from mice without tumors). Co-cultures received either no siinfekl (“no activation” group) or siinfekl (“activated” groups), with or without the IDO-pathway inhibitor 1-methyl-D-tryptophan (1MT).
(B) Foxp3GFP mice with established B16F10 tumors were treated with naive pmel-1 T cells (CD8+, CFSE-labeled) plus hgp100 peptide vaccine in IFA+CpG, with or without 1MT in drinking water. Representative of 5 experiments.
(C) Cd40lg−/− host mice received pre-adoptive transfer of sorted Eos-labile or Eos-stable Treg cells from Foxp3GFP mice; or all other non-regulatory CD4+ cells; or no transfer. Then all mice were implanted with B16F10 tumors. After 7 days, mice received pmel-1 + vaccine, with or without 1MT in drinking water. Four days after vaccination, TDLNs were analyzed and tumor size was measured at necropsy. Pooled data from 3 identical experiments; * p<.05 by ANOVA, bars show SD.
(D) DCs from VDLNs (prepared as in Figure 1C), which have low IDO expression, were used in reprogramming co-cultures, with or without added KYN-metabolite mixture as described in Supplemental Experimental Procedures.
(E–G) Treg cells were incubated for 18 hrs in reprogramming co-cultures as in panel D, then stained for intracellular phospho-STAT3 (pSTAT3). (E) effect of KYN metabolites. (F) dose-response for a representative KYN metabolite, 3-hydroxyanthranilic acid (3HAA); percentage of gated Treg cells staining positive for pSTAT3 is shown. (G) response of pSTAT3 to exogenous recombinant IL-6, with or without 50 uM 3HAA (gated Treg cells).
Each panel representative of at least 3 experiments, or as noted. See also Figure S7.

