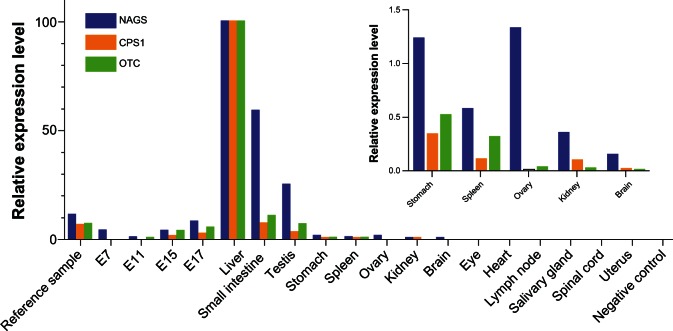
Figure 1.
Relative expression levels of mouse NAGS, CPS1, and OTC mRNA in mouse tissues and stages of embryonic development. Insert shows relative expression of NAGS, CPS1 and OTC mRNA in the stomach, spleen, ovary, kidney and brain. Expression of NAGS, CPS1, and OTC mRNA was measured using quantitative real-time PCR and normalized to their mRNA abundance in liver. 1 μg of total mouse RNA from ovary, testis, brain, eye, heart, kidney, liver, lymph node, submaxillary gland, spinal cord, spleen, stomach, uterus, intestine, 7-day embryo, 11-day embryo, 15-day embryo, 17-day embryo was reverse transcribed to cDNA using random primers. Real time PCR was carried out using primers designed to anneal to different exons to avoid amplifying genomic DNA.

