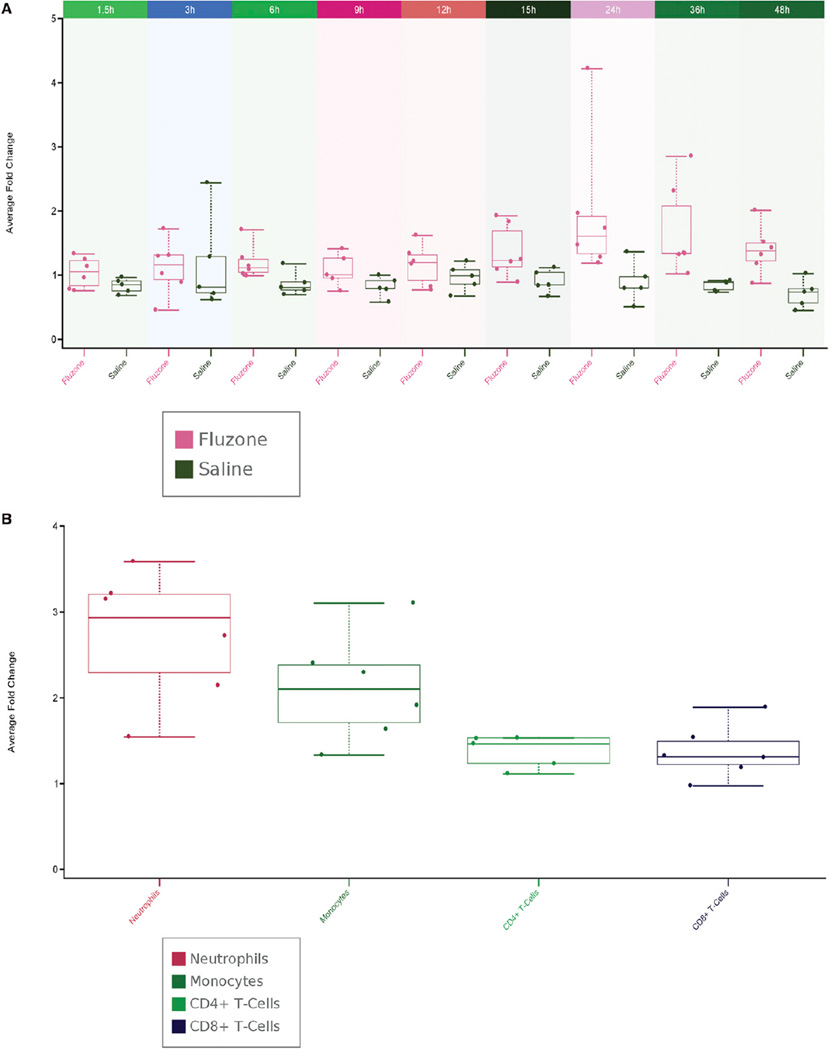
Figure 5. Profiling the Interferon Response within the First 48 hr following Vaccination.
(A) Baseline-normalized whole-blood expression levels of genes forming module M1.2 (IFN-inducible gene module) were averaged and plottedonagraph. Values are shown at multiple consecutive time points for the influenza vaccine and saline control groups. For concomitant serum increase of IFN-inducible chemokine CXCL10 (IP-10), see Figure S4.
(B) Baseline-normalized expression levels of genes forming module M1.2 were averaged and plotted on a graph. Values are shown for different cell populations isolated from the blood of subjects24 hr postvaccination. Box plots with whiskers indicating minimum and maximum value. An interactive supplement is available for this figure, where detailed sample information is accessible seamlessly for each data point on the graph (iFigure 5: http://www.interactivefigures.com/dm3/vaccine-paper/figure-5.gsp).

