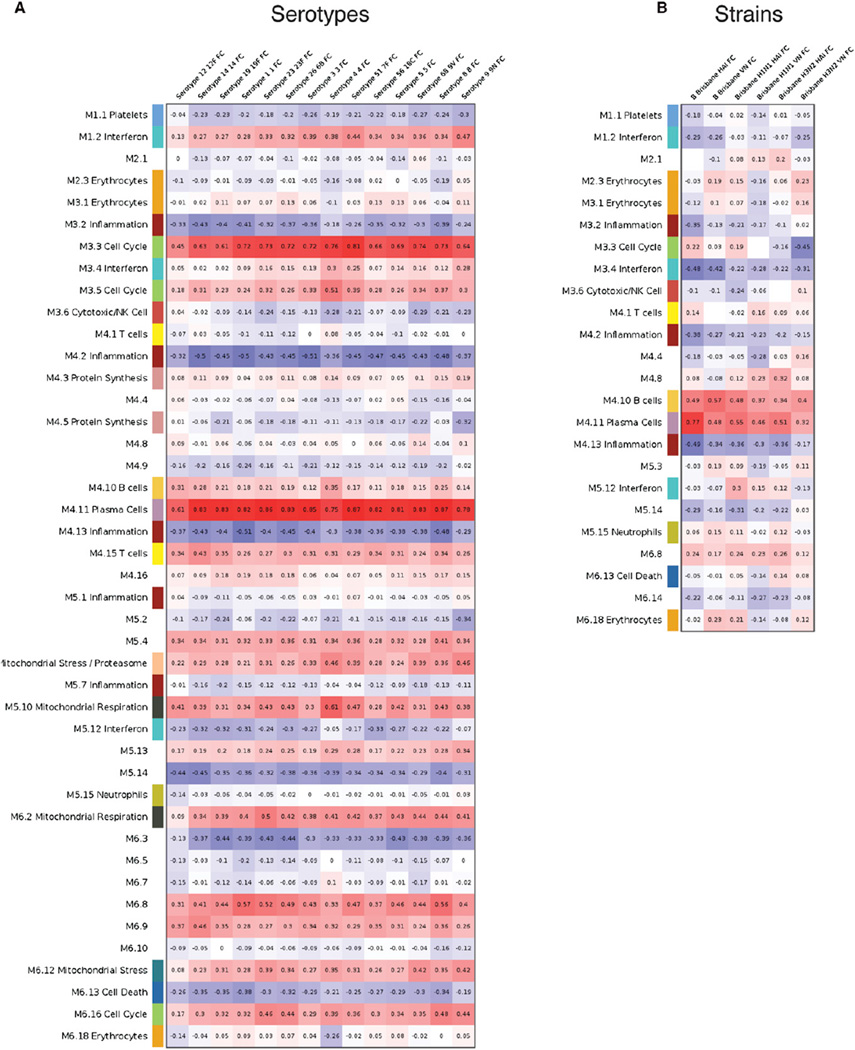
Figure 7. Correlation Patterns of Day 7 Transcriptional Data and Antibody Titers.
Correlations between day 7 baseline-normalized averaged modular expression profiles and fold change of day 28 antibody titer over baseline for all available pneumococcal serotypes and influenza vaccine strains are represented on a heatmap. Modules are shown in rows and serotypes in columns. Red indicates strong positive correlation, and blue indicates strong negative correlation. (A) shows pneumococcal vaccine, and (B) shows influenza vaccine (D28/baseline fold change [FC] in virus neutralization [VN] and hemagglutinin [HAI] titers). An interactive supplement is available for this figure that allows users to dynamically filter modules and select additional parameters for correlation (iFigure 7: http://www.interactivefigures.com/dm3/vaccine-paper/figure-7.gsp). Correlations and associated p values were calculated via the Spearman method and can be adjusted by using a slider; Benjamini-Hochberg multiple testing correction is controlled by an on/off toggle. For details on serological response, see also Figure S1 and Table S3 and Table S4.

