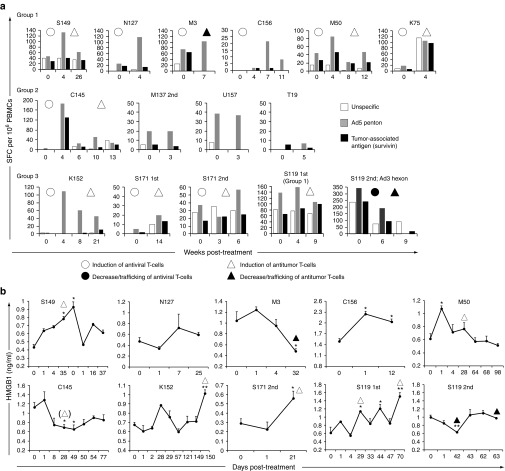
Figure 3.
Antitumor T-cells are stimulated by combination treatments and correlate with HMGB1 secretion into serum; a potential marker of immunogenic cell death. (a) Peripheral blood mononuclear cells (PBMCs) were pulsed with peptide mix for adenovirus serotype 5 (Ad5) penton (gray bars) or for survivin (black bars), a ubiquitous tumor-associated antigen, and assessed for T-cell activation by interferon-γ ELISPOT analysis. Unspecific T-cell responses were also observed, which might include other tumor epitope-directed T-cells (white bars). Induction of antitumor T-cells was observed in eight cases (open triangles) and decrease/trafficking in two cases (closed triangles). Adenovirus-specific T-cell activations were seen in 10/15 cases (open circles). Patient S119 received temozolomide (TMZ) according to group 1 and later group 3; for convenience, both are shown in the group 3 row. The adenoviral peptide mix was for serotype 3 in the latter case (Ad3 hexon). (b) Quantitative determination of HMGB1 in patient serum was performed by enzyme-linked immunosorbent assay. Significant elevations of the immunogenic signal over baseline were observed in 60% of patients (*P < 0.05; **P < 0.01; unpaired t-test). HMGB1 titer change correlated with antitumor T-cell responses (triangle markers) in 8/9 evaluable cases. The only exception was patient C145, who showed a high antitumor T-cell induction at week 4 post-treatment, but lacked HMGB1 elevation at the time (triangle in parenthesis). The nine evaluable cases were S149, N127, M3, M50, C145, K152, and S171 2nd, S119 1st, and S119 2nd treatment rounds; Patient C156 had absolute T-cell counts below the limit of reliable detection and was therefore excluded from statistical analyses. Error bars represent the mean ± SEM, n = 3 per timepoint. 1st, initial treatment rounds; 2nd, later treatment rounds; Group 1, TMZ before virus; Group 2, TMZ before and after virus; Group 3, TMZ after virus; HMGB1, high-mobility group box-1; SFC, spot-forming colonies.

