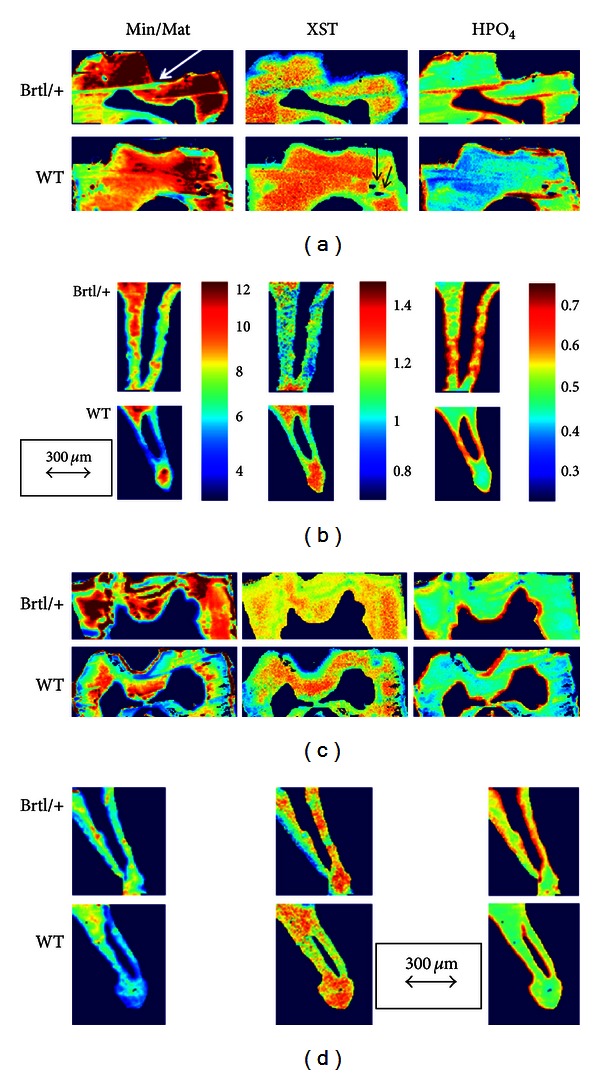
Figure 4.

Typical FTIRI images for Brtl/+ and WT molars showing mineral/matrix ratio (Min/Mat), crystal size and perfection (XST), and acid phosphate content (HPO4) in (a) first molar crowns at 2 months; (b) second molar root at 2 months; (c) first molar crowns at 6 months; and (d) second molar root at 6 months. The arrows indicate the distance corresponding to 300 μm. The color bars shown for (b) are the same for all similar parameters in the figure. White arrow indicates folds in specimen while black arrows show holes in the replicate images. These areas were masked when calculating numeric data.
