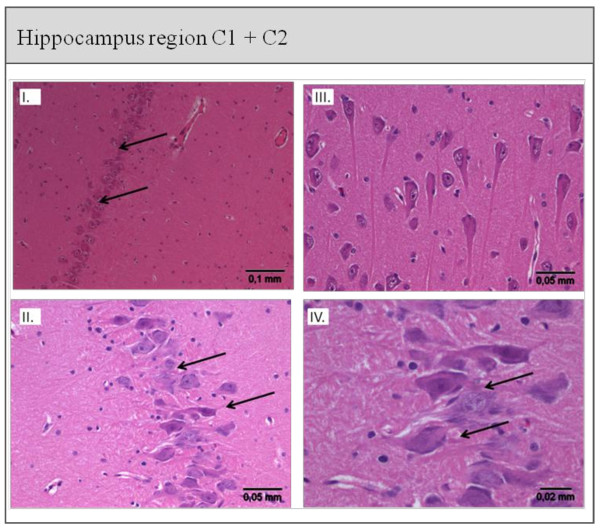
Figure 4.
Histological staining of the Hippocampus region C1 + C2 from the Control (I. + II.) and AAP (III. + IV.) group. I. + II. Hippocampus cells of the C1 and C2 regions from a control animal: cell formation intact and regular, normal neuron density (→). III. + IV. Hippocampus cell of the C1 and C2 region from an AAP animal: abnormal cell formation, cell damage, shrinkage of neurons, basophilic neurons with core pyknosis (←). Scoring: I: 5 to 10 damaged cells; II: damaged cell groups; III: unions of damaged cells; IV: massive cell loss.

