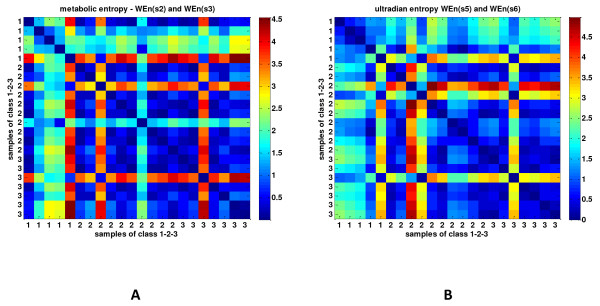
Figure 5.

Clusters of dissimilarity between the three groups of patients. Pairwise distance and visualization of the dissimilarity matrix, based on the euclidean distance, between wavelet entropy of scales reflecting metabolic (a) and other unknown inputs (b) on very-low-frequency (scales 2 to 3, 0.025 to 0.006 Hz) and ultra-low-frequency bands (scales 5 to 6, 0.003 to 0.0007 Hz), respectively. Red color reflects dissimilarity (high distance), and blue color, similarity (small distance) between patients belonging to groups 1, 2, and 3.
