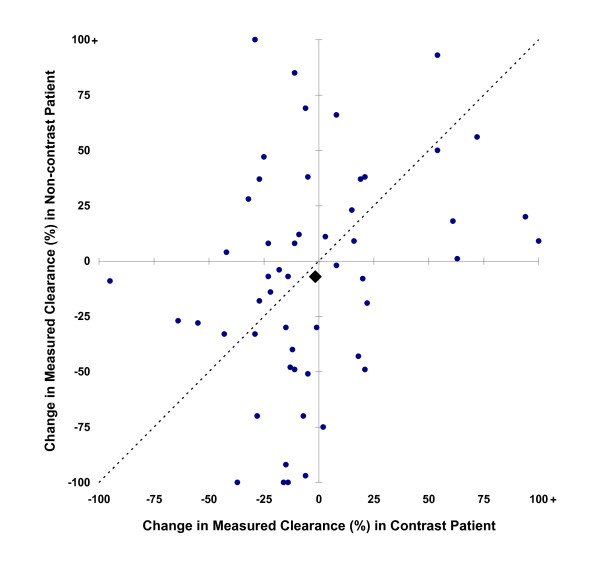
Figure 4.
mCrCl three days after scanning, relative to pre-scan values. Filled circles represent individual matched patient pairs, and the filled diamond mean values for contrast and non-contrast patients. Points above the diagonal line imply greater loss of renal function in the patient who received contrast, and below the line greater loss in the patient who did not receive contrast.

