
Figure 1.
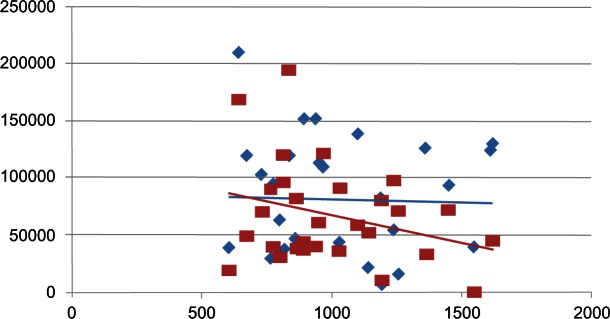
Average decrease in mean erythropoietin alpha dose.
Notes: The average decrease in mean erythropoeitin alpha dose between the losanges (blue), before treatment with vitamin B12 and the squares (red), after treatment with vitamin B12, with the corresponding trendlines.