. Author manuscript; available in PMC: 2013 Jun 13.
Published in final edited form as: Bioorg Med Chem Lett. 2011 Jul 21;21(18):5239–5243. doi: 10.1016/j.bmcl.2011.07.043

Table 2.

SAR study for the piperazine region*

Entry Compd X 1% O2 IC50 (uM)
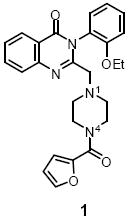
graphic file with name nihms313590t2.jpg 1 1 graphic file with name nihms313590t3.jpg 0.43
2 11 graphic file with name nihms313590t4.jpg 0.47
3 12 graphic file with name nihms313590t5.jpg 1.7
4 13 graphic file with name nihms313590t6.jpg 9.4
5 14 graphic file with name nihms313590t7.jpg 0.81
6 15 graphic file with name nihms313590t8.jpg 27.5
graphic file with name nihms313590t9.jpg 7 39 graphic file with name nihms313590t10.jpg 27.6
8 16 graphic file with name nihms313590t11.jpg 0.09
9 17 graphic file with name nihms313590t12.jpg 0.16
10 18 graphic file with name nihms313590t13.jpg 27.6
11 19 graphic file with name nihms313590t14.jpg inactive
*

Values of IC50 are the mean of three independent experiments.