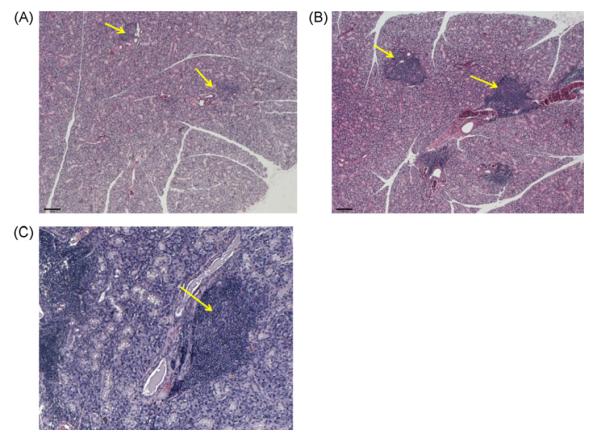
Fig. 8.
Focus score between treated and non-treated mice. Light micrographs of mouse salivary glands stained with hematoxylin and eosin. Focus score was not significantly different between non-tread and treated groups. The size of the focus score, however, was slightly bigger in the non-treated mice (B) when compared to the BM cells and CFA-treated mice (A and C) (p > 0.05).

