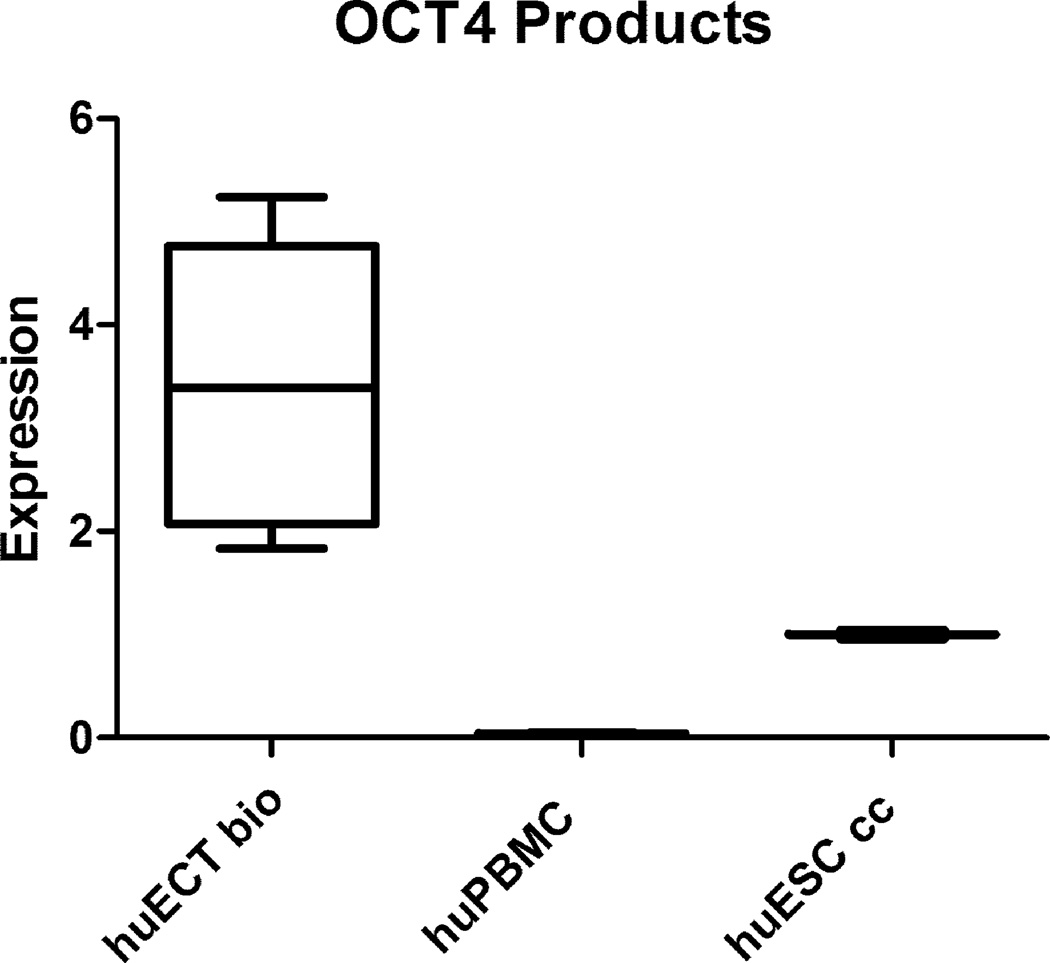
Figure 8.
OCT4A gene expression products’ concentrations in the cells biopsied directly from the primary tumors of the patients diagnosed with the embryonal carcinoma of the testes (huECT bio) (the patients encoded 001–009), from peripheral blood (huPBMC), the cultured human embryonic stem cell lines (H1, H13, H14) (huESC cc) were quantified on blots described in the figure 6, normalized against actin, compared to the averaged values of huESC cc, which were considered as 1, as displayed as the ratio (y-axis). Each batch was run in triplicates. The data presented in this figure are representative to all the patients’ samples and the controls. The differences between the samples are shown as the standard deviations. The statistical significance was accepted at p < 0.001.

