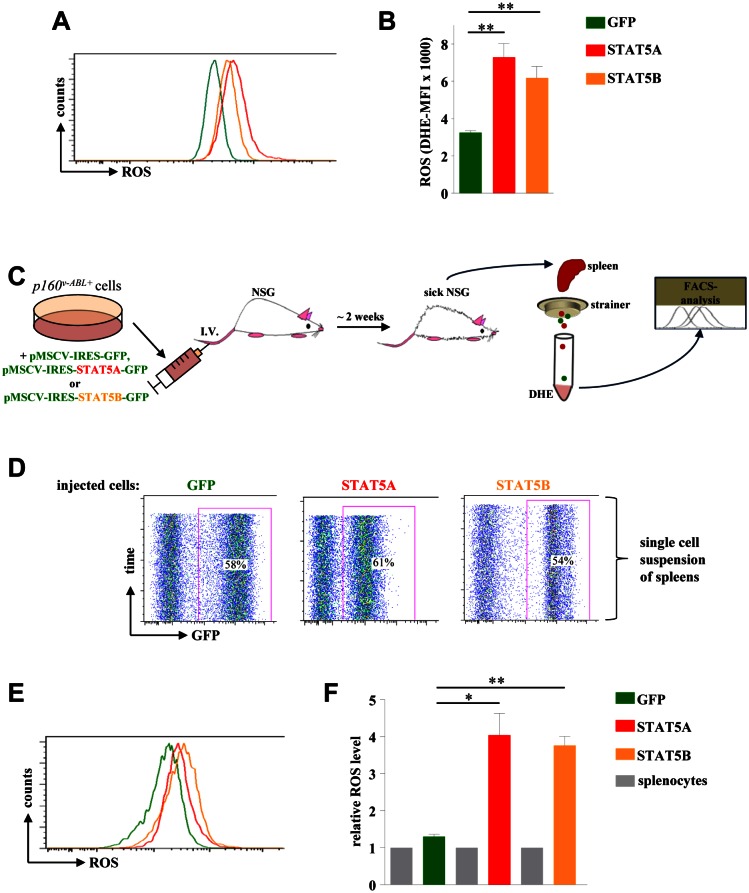
Figure 5. STAT5A and STAT5B expression mediates ROS production in a leukaemia mouse model.
(A) p160v-ABL transformed murine cells were infected with a retrovirus encoding for GFP, STAT5A or STAT5B and subsequently used to measure ROS levels via DHE staining. (B) Statistical analysis showing DHE-MFI of individually derived p160v-ABL+ cell lines (n = 3). (C) Scheme of experimental procedure used to analyse ROS production of Abelson transformed cells in an in vivo mouse model for leukaemia. (D) FACS blots of single cell suspensions derived from the spleens of diseased mice. The percentage of leukemic cells infiltrating the spleen is shown within the blot. (E) FACS histogram of ex vivo derived leukemic cells expressing GFP, STAT5A or STAT5B stained with DHE to analyse differences in ROS levels. (F) Relative ROS level of ex vivo derived leukemic cells. The fold change in ROS (DHE-MFI) compared to GFP-negative splenocytes is depicted (n = 3). (B and F) Bar graphs represent mean ± SD. * p < 0.05, ** p < 0.01.

