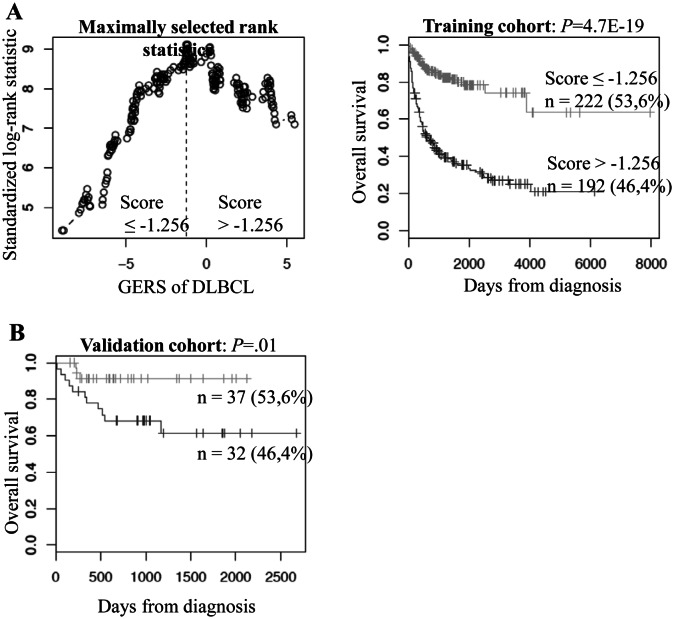
Figure 2. Prognostic value of GERS in DLBCL patients.
A. Patients of the training cohort (n=414) were ranked according to increasing GERS and a maximum difference in OS was obtained with a score =-1.256, splitting patients into a high risk (46,4%) and a low risk (53,6%) groups. B. The prognostic value of GERS was assayed on an independent cohort of 69 patients (validation cohort). The parameters to compute GERS of patients in the validation cohort and the proportions delineating the 2 prognostic groups were those defined with the training cohort.

