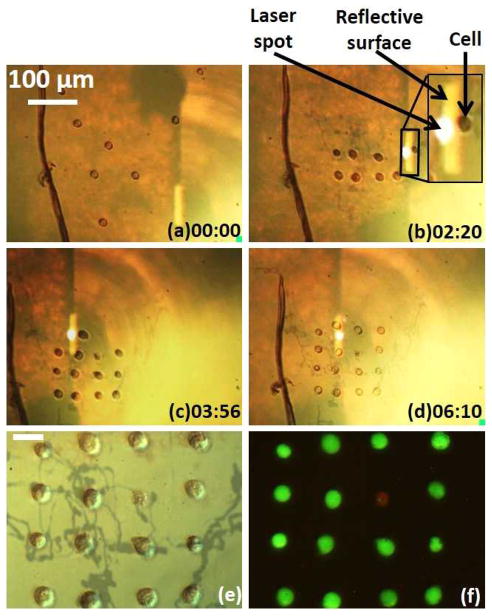
Fig. 5.
Manipulation of NIH/3T3 cells in PEGDA. The time stamp format is minutes : seconds. (a–d) Cells are assembled by the OTMm. The inset shows a close image of the cell being manipulated. The reflective surface is the emitting surface of the laser diode, due to the match of the focal plane of the microscope objective lens and laser projection objective lens. (e) Single-cell pattern after PEGDA gelation. The dark tracks may be due to the laser heating of the substrate, but they do not affect the OTMm operation. The scale bar is 20 μm, and also applies to (f). (f) Viability test on the assembled cells. Green fluorescence indicates that the cell is viable, while red fluorescence indicates a non-viable cell.

