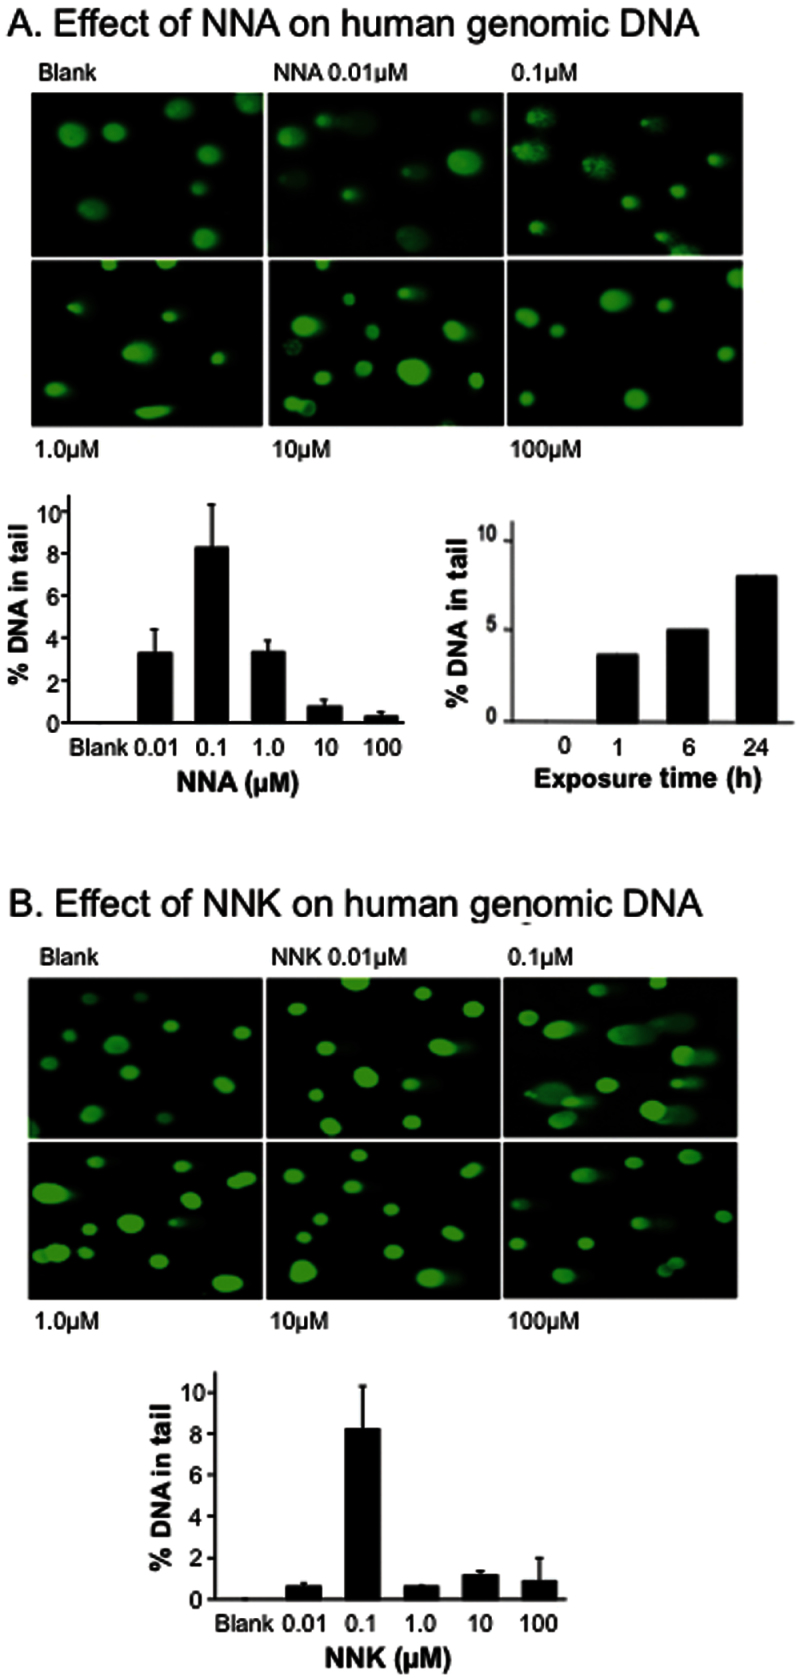
Fig. 4.
(A) Genotoxic effect of NNA in human HepG2 cells as measured by the Comet assay. Cultured cells were exposed to increasing doses of NNA dissolved in DMEM with or without 10% FBS for 24h, before being processed by the Comet assay. The histogram on the lower left depicts the mean % of DNA in tail ± SEM of three independent experiments. The histogram on the lower right depicts the time-dependent change in % DNA in tail in HepG2 cells at 0.1 µM concentration of NNA. (B) Genotoxic effect of NNK in HepG2 cells measured under identical assay conditions. The histogram depicts the mean % of DNA tail ± SEM of three independent experiments.

