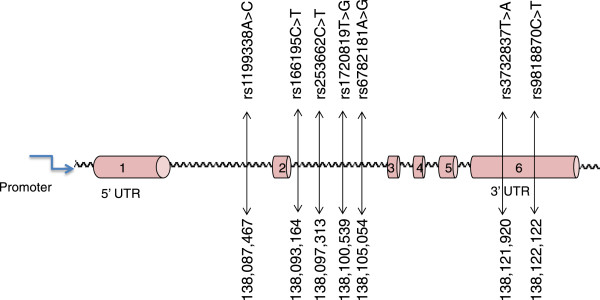
Figure 2.

Schematic diagram of the MRAS (not to scale). The figure shows studied SNPs sequentially arranged according to their chromosomal position (based on transcript NM_001252090). These SNPs were detected with a prevalence of >0.1 in the general population.
