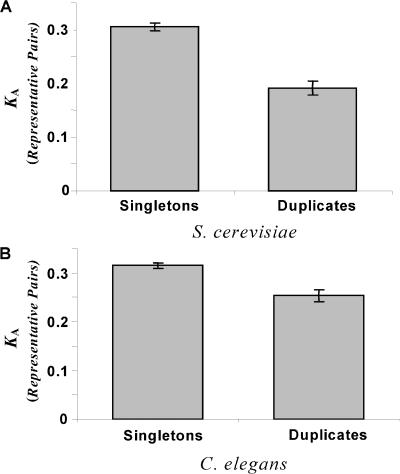
Figure 2. A Comparison of the Evolutionary Rates of Duplicate and Singleton Genes.
The average rate of nonsynonymous evolution (K A) for representative pairs of duplicate and singleton genes in the two study organisms S. cerevisiae (A) and C. elegans (B) is shown. Representative pairs of duplicate genes evolve significantly more slowly in both study organisms (Mann–Whitney U test, p < 0.001).

