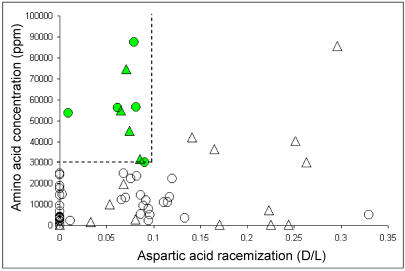
Figure 1. Amino Acid Analyses of 64 Hominid Remains.
For each bone, the extent of aspartic acid racemization (D/L) and the amino acid concentration (ppm) is given. The dash lines delimit the area of amino acid preservation compatible with DNA retrieval. Circles and triangles represent early modern humans and Neandertals, respectively. The samples from which DNA extractions were performed are green (see also Table S1).

