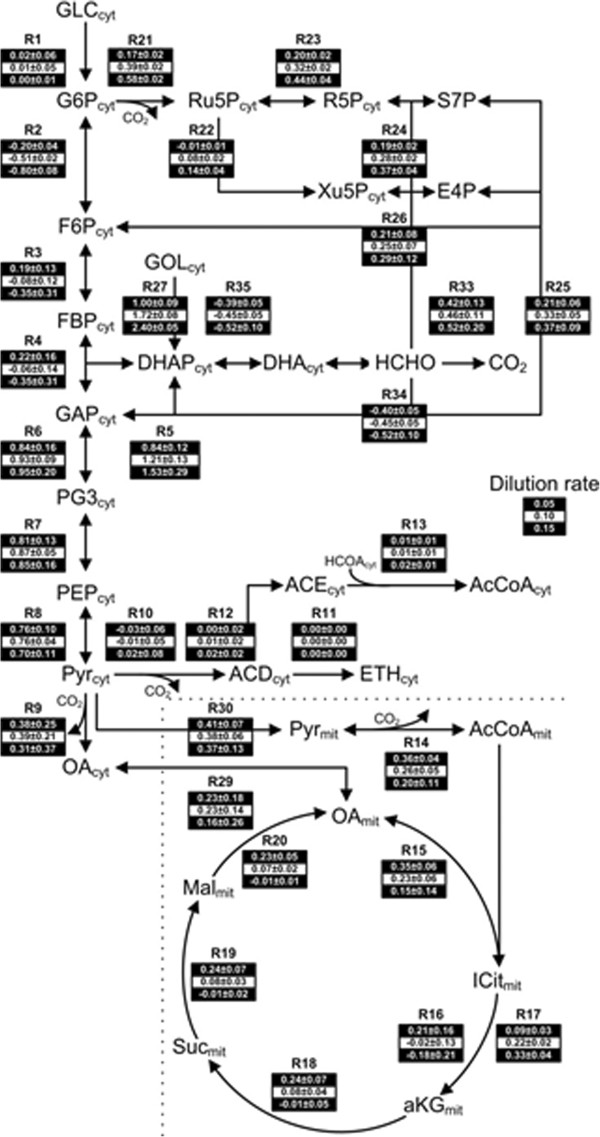
Figure 4.

Metabolic flux distribution in Pichia pastoris and respective intracellular flux NIR predictions in glycerol-limited chemostat at low (state A=0.05 h-1), medium (state B=0.10 h-1) and high (state C=0.15 h-1) dilution rates. The fluxes for each reaction in the network corresponding to a D of 0.05, 0.10 and 0.15 h-1 are given from top to bottom, respectively (mmol/gDCW/h). Metabolites names are displayed in bold: GLC = glucose; G6P = glucose-6-phosphate; F6P = fructose-6-phosphate; FBP = fructose-1,6-biphosphate; GAP = glyceraldehyde-3-phosphate; DHAP = dihydroxyacetone phosphate; DHA = dihydroxyacetone; HCHO = formaldehyde; CO2 = carbon dioxide; GOL = glycerol; RU5P = ribulose-5-phosphate, XU5P = xylulose-5-phosphate; R5P = ribose-5-phosphate; S7P = sedoheptulose-7-phosphate; E4P = erytrose-4-phosphate; PG3 = 3-phosphoglycerate; PEP = phosphoenolpyruvate; PYR = pyruvate; ACD = acetaldehyde; ETH = ethanol; AcCoA = acetyl CoA; ACE = acetate; OA = oxaloacetate; ICIT = citrate; aKG = alpha-ketoglutarate; Suc = succinate; Mal = malate; (cyt) = cytosol; (mit) = mitochondria.
