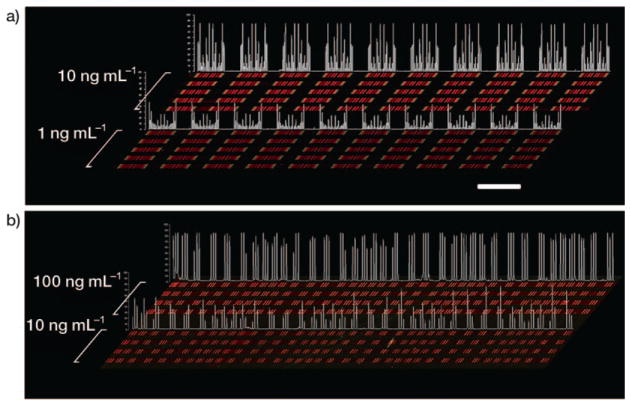
Figure 3.
Contrast-enhanced raw data extracted from multi-protein calibration experiments performed on a substrate prepared according to a) Scheme 2 and b) Scheme 3. Each red bar represents a unique protein measurement, and is clustered with up to ten additional proteins (for Scheme 2). The clusters become symmetrical due to the winding nature of the barcode pattern, so that each cluster actually contains two measurements of each protein. Clustering is less evident in (b) because lower-density barcode pattern was employed. Recombinant proteins were analyzed across five discrete channels per concentration for (a) and four discrete channels per concentration for (b); quantitative data for statistical analysis was extracted from all the repeats in each of the channels. By utilizing identical DEAL cocktails followed by identical standard protein cocktails, the reproducibility was also checked. The identical signal patterns within individual channels and between channels of similar concentrations demonstrate the good uniformity and quality of DNA barcodes. Signal intensity profiles sampled from one analysis channel per concentration are quantified in white. Scale bar: 2 mm.

