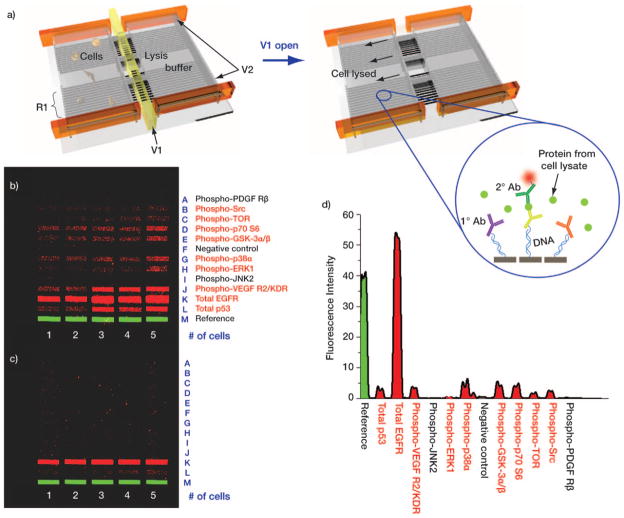
Figure 4.
a) Schematic representation of the single-cell, intracellular protein analysis device. Single or few cells are incubated in an isolated chamber under varying stimuli. Intracellular proteins are assayed by introducing a pre-aliquoted lysis buffer, whereupon the released proteins bind to the DEAL (DNA-labeled antibody) barcode within the chamber. V1: valve for lysis buffer control, V2: valve for isolated chamber formation, and R1: DNA barcode array converted into DEAL antibody array. b), c) Contrast-enhanced images of developed barcode assays highlight the benefits of using Scheme 2 (b) versus Scheme 1 (c). Protein names listed in red font correspond to those which were detected using Scheme 2 barcodes. d) Representative fluorescence intensity profile from the single-cell lysate of (b).

