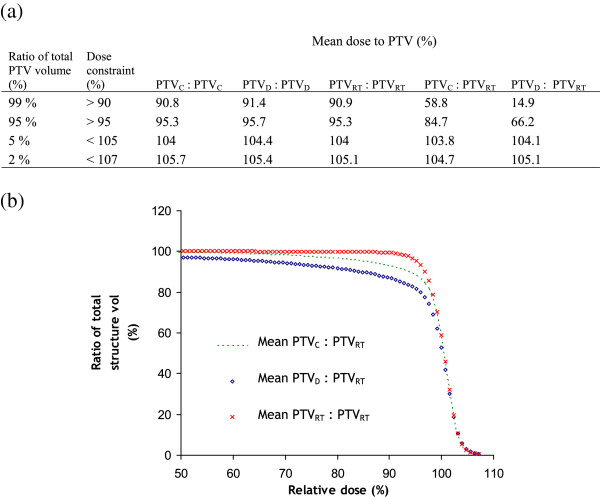
Figure 4.
Mean DVH values and mean DVHs. (a) Values obtained from mean DVHs optimizing for each PTV but investigating the dose to each PTV and (b) mean DVHs optimizing for each PTV but investigating the dose to PTVRT. The PTV left of the colon indicates the PTV for which the VMAT plan was optimized and right of the colon indicates the PTV under examination. DVH: dose volume histogram; PTVC: PTV delineated using the CT with the diagnostic MRI scan viewed on a separate console; PTVD: PTV delineated on the CT registered with the diagnostic MRI scan; PTVRT: PTV delineated on the CT registered with the MRI scan in the radiotherapy position.

