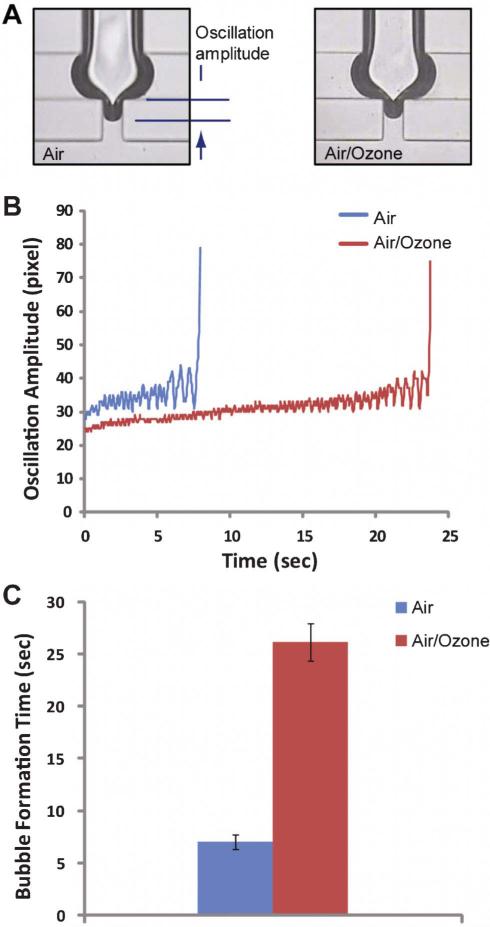
Fig. 3.
(A) Snap shots of the bubble formation component after 10 frames (0.33 s) from the previous bubble formation. (B) Time-lapsed trajectories of the lower end point of the interface. Stronger oscillation for a shorter time period was observed when air was the working gas. (C) The required time for the bubble formation. The averaged time for the fifteen bubbles is shown.

