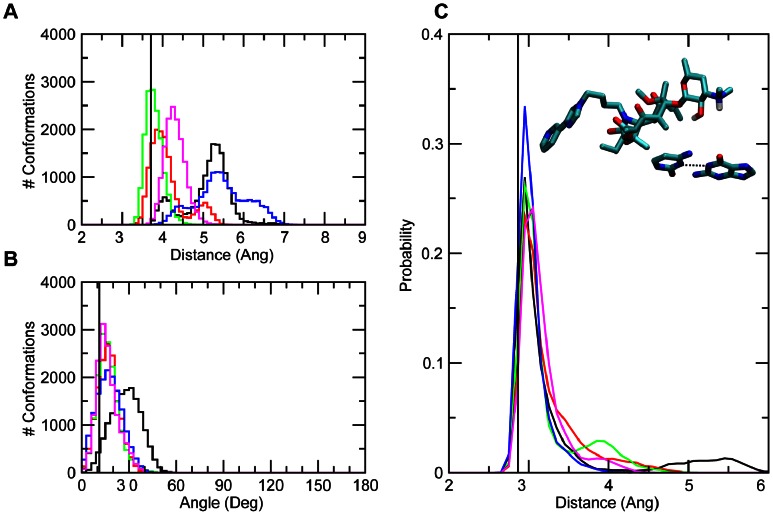
Figure 7. The number of conformations for WT, A2058G mutant and methyl modifications of (A) COM distances between the base atoms of 2057 and 2058 and (B) angles between planes comprised by 2057 and 2058 base atoms.
The probability distributions for (C) WC G2057 N1 to C2611 N3 distances. The crystal structure values are shown as vertical black lines, while distributions from the GCMC/MD simulations are shown as WT (black), A2058G (red), MAD1 (green), MAD2 (blue), and DMAD (magenta).

