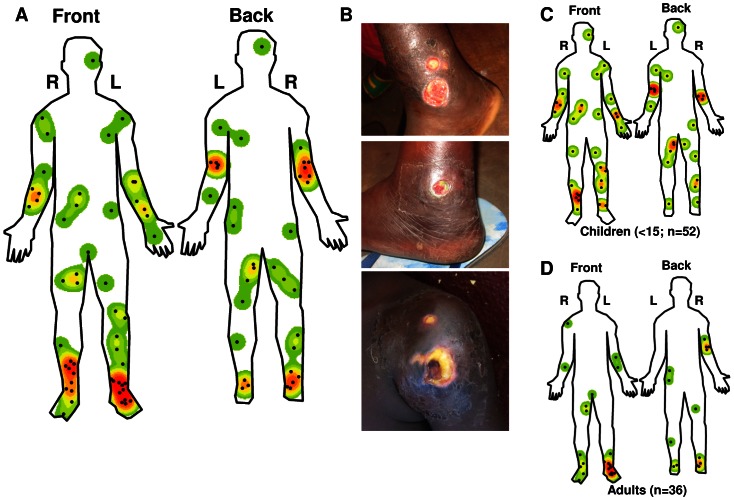
Figure 5. Lesion localization.
The localization of the lesions of all the RT-PCR confirmed BU patients (88) were mapped in detail and Kernel function was used to create a heat map of the lesion distribution (A). The localization of the lesions on the front and back and left (L) and right (R) of the patient's bodies are shown. Studying the distribution of lesions, it was noted that they often occur at joints (B, example of two lesions on the ankle and one on the shoulder). Distribution of lesions in children (C, n = 52) and adults (D, n = 36) were also analyzed separately.

