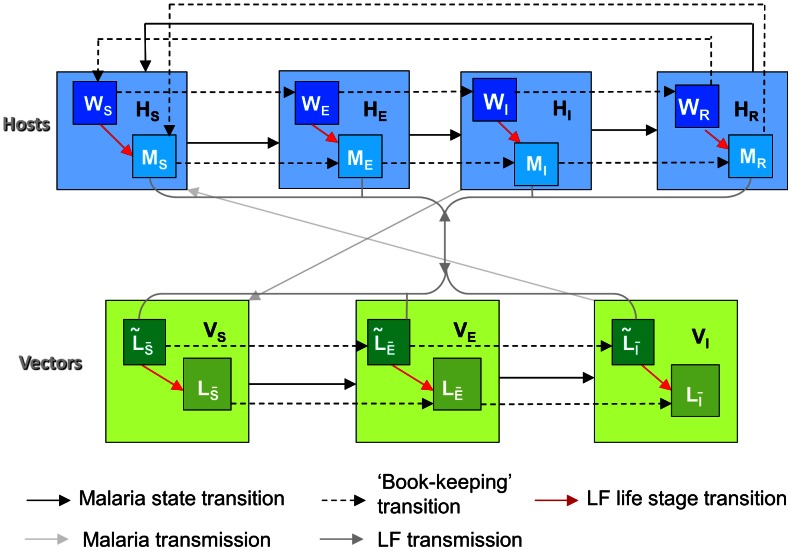
Figure 3. Structure of the full malaria-LF co-infection model.
(NB. Life stage transition arrows from each L compartment to each W compartment should also strictly be present, but these are omitted here for clarity. All birth and deaths rates are also omitted, as well as the labelling of rates in terms of model parameters).

