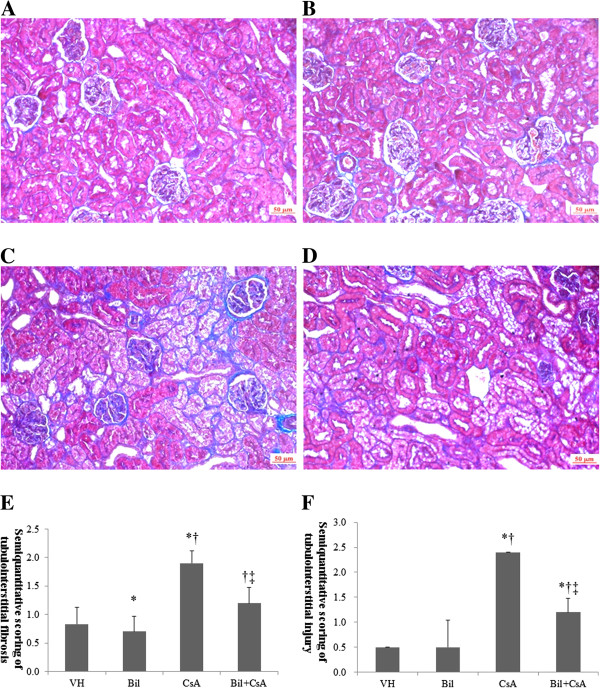
Figure 3.

Afferent arteriolopathy in CsA-treated rat kidneys. A: Vehicle (VH), B: Bilirubin (BIL) C: CsA, and D: BIL + CsA groups E: Semiquantitative scoring of arteriolopathy according to mean percentage of afferent arterioles injured, which was estimated in at least 100 preglomerular afferent arterioles from the A, B, C and D groups (PAS stain, ×200). Compared with CsA group, BIL + CsA group displayed afferent arteriolopathy. The data are the means ± SD. *P < 0.05 vs. VH, †P < 0.05 vs. BIL, and ‡P < 0.05 vs. CsA.
