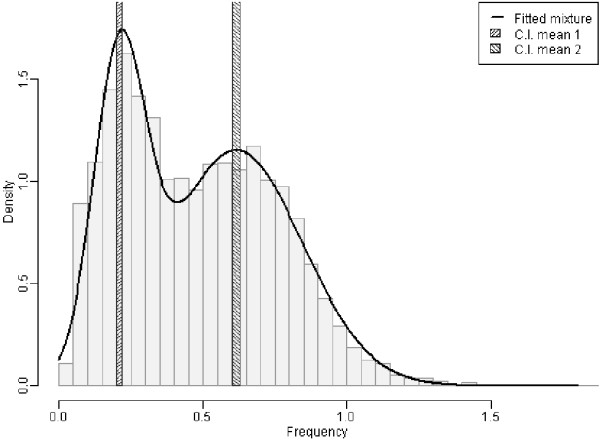
Figure 2.

Histogram of CpGo/e ratio in B. glabrata transcripts. CpGo/e ratio was measured as a proxy to estimate the CpG methylation in transcripts from RNA-seq libraries from B. glabrata guadeloupian strain (Bg Gua). X axis: CpGo/e ratio, Y-axis density of transcripts. The figure displays a histogram of Bg Gua CpGo/e ratios with a fitted mixture distribution. The grey shaded bars represent 95% confidence intervals for the two mean values. The estimated mean values of the two components are 0.209 and 0.616.
