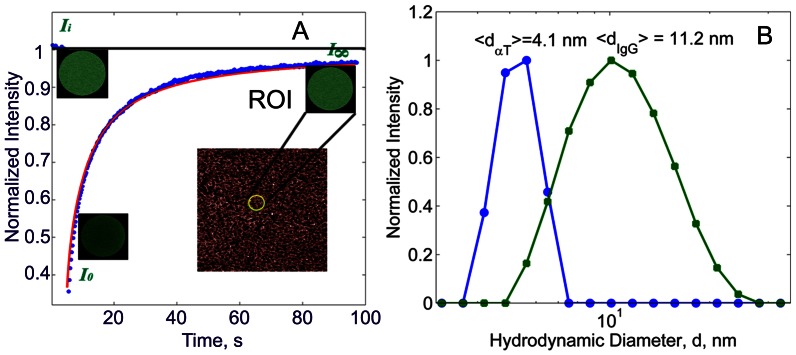
Figure 2. A: FRAP microscopy of fluorescently labeled Fab fragments of IgG.
For a typical FRAP experiment performed on a fibrin network, the regions of interest (ROIs, radius of 27  m) before, immediately after photobleaching, and after 98 s are shown (green circle). Normalized fluorescence recovery for the corresponding ROIs and their fits according to a model (Equation (7), ) are shown by symbols and a line, respectively. Fluorescence intensity values before (
 ) and after (
 ) photobleaching, and at the end of the experiment (I∞), are shown. For each sample, FRAP measurements were repeated 3 times in 8 different locations over the sample and the arithmetic mean of the intensity curves was taken. B: Hydrodynamic diameter measurements by dynamic light scattering: circles denote
  -thrombin and squares denote Fab IgG.

