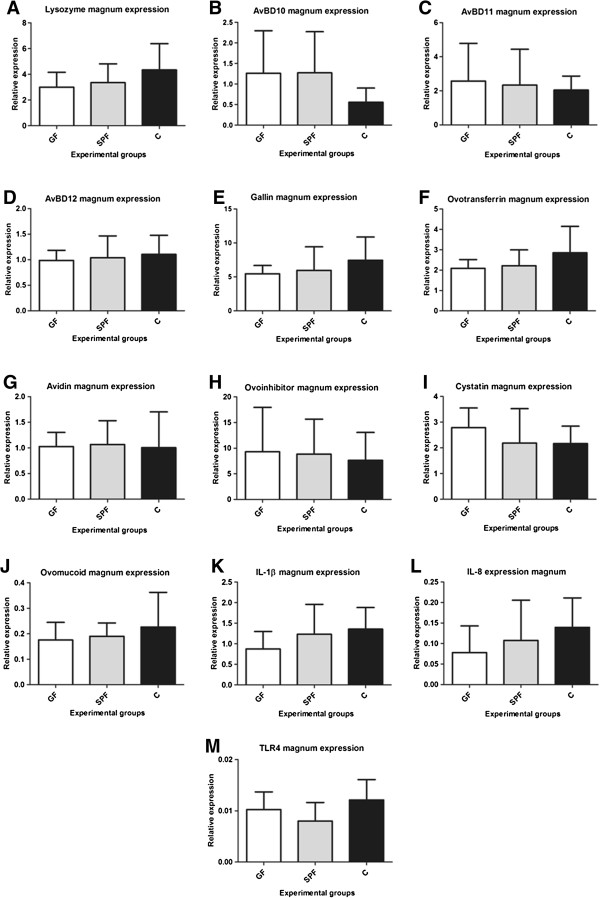
Figure 3.

Genes expression levels in the magnum of GF, SPF and C groups. Gene expression levels of lysozyme (A), AvBD 10 (B), AvBD 11 (C), AvBD 12 (D), gallin (E), ovotransferrin (F), avidin (G), ovoinhibitor (H), cystatin (I), ovomucoid (J), IL1-β (K), IL8 (L) and TLR4 (M) in the magnum as assessed by RT-qPCR showed no difference among the three experimental groups GF, SPF and C (n = 8; mean ± standard deviation, * p < 0.05). Data in A, D, G, H, I, K, L and M were analysed using one-way ANOVA followed by the Bonferroni-Dunn test; data in B, C, E, F and J were analysed using the Kruskal-Wallis test followed by the Mann–Whitney test.
