FIGURE 6:
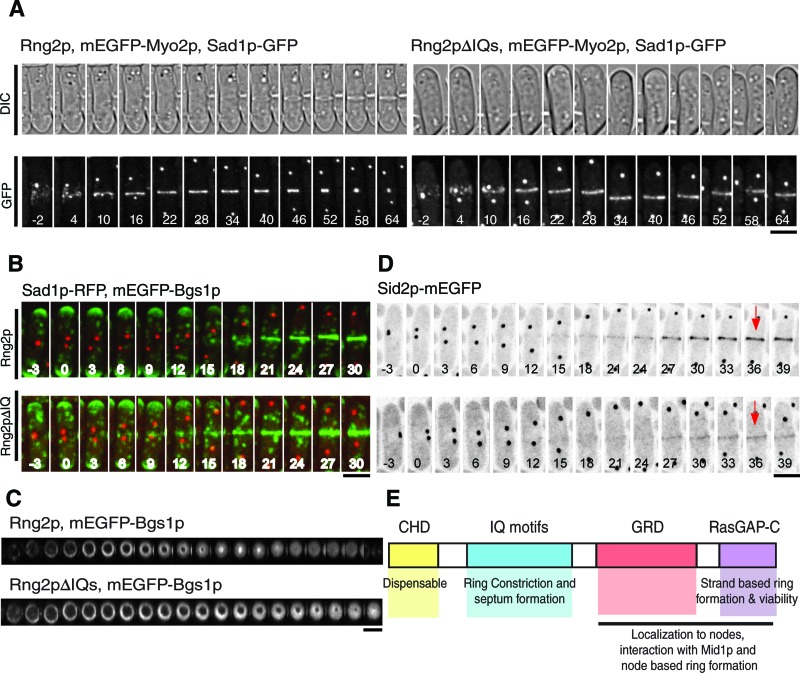
Localization of mEGFP-Myo2p, mEGFP-Bgs1p, and Sid2p-mEGFP in the contractile rings of cells complemented with Rng2pΔIQ and full-length Rng2p. (A) Time series of fluorescence and DIC micrographs at 6-min intervals at 25°C of rng2Δ cells expressing Sad1-GFP and mEGFP-Myo2p (both shown in white) complemented with (left) full-length Rng2p or (right) Rng2pΔIQ. Time in minutes is shown in white, with SPB separation defined as time zero. (B) Time series of fluorescence micrographs at 3-min intervals at 25°C of rng2Δ cells complemented with Rng2p (top) or Rng2pΔIQ (bottom) expressing mEGFP-Bgs1p (green), and Rlc1-RFP (red). Maximum intensity projections were formed from 20 Z-slices collected at each time point. Time in minutes is shown in white, with SPB separation defined as time zero. (C) Time series of Z-sections in the plane of the contractile ring reconstructed from Z-stacks of fluorescence micrographs recorded at 3-min intervals at 25°C of rng2Δ cells expressing mEGFP-Bgs1p and complemented with (top) Rng2p or (bottom) Rng2pΔIQ. In each series, the second image corresponds to the onset of constriction. (D) Time series of negative-contrast fluorescence micrographs at 3-min intervals at 25°C of rng2Δ cells expressing Sid2p-mEGFP complemented with (top) Rng2p or (bottom) Rng2pΔIQ. The fluorescence intensities of the rings were measured at the time points indicated with red arrows. (E) Summary of the contributions of the four domains of Rng2p to cytokinesis. Scale bars, 5 μm.

