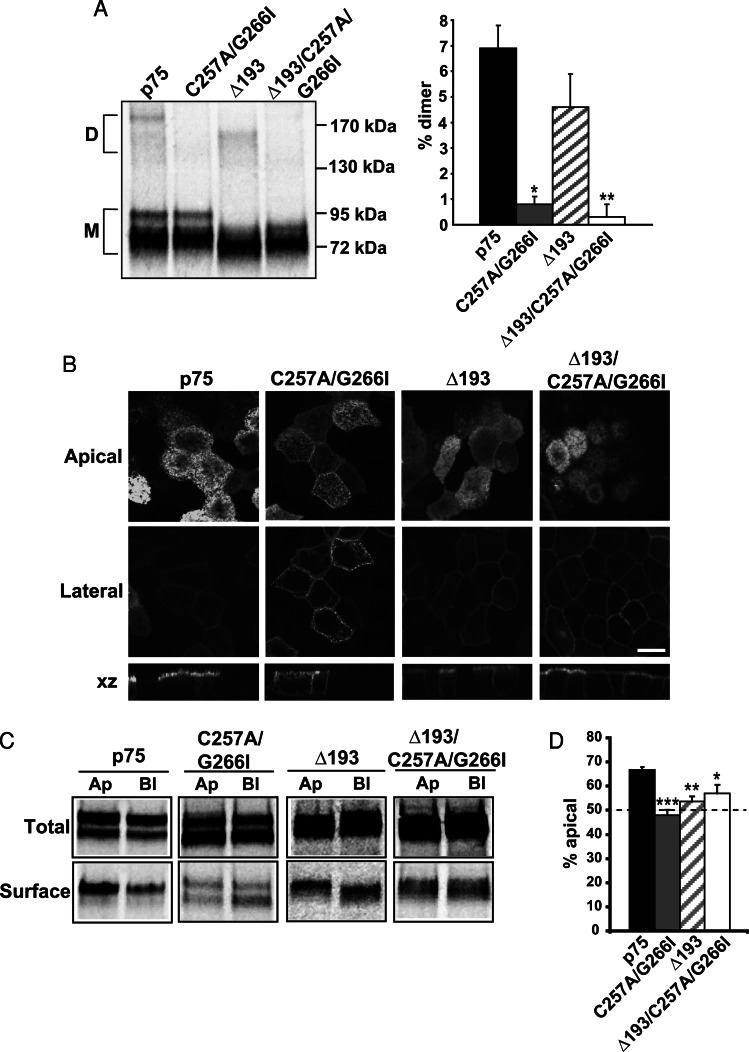
FIGURE 2:
Disrupting dimerization reduces p75 apical sorting efficiency. (A) MDCK cells expressing p75 or the C257A/G266I, Δ193, and Δ193/C257A/G266I mutants were radiolabeled for 2 h and then solubilized, and p75 proteins were immunoprecipitated and analyzed by PAGE under nonreducing conditions. A representative gel is shown with the migration of molecular mass standards indicated on the right (D, dimer; M, monomer). Results of three experiments performed in duplicate or triplicate are plotted (mean ± SEM). Unpaired t test: *, p < 0.001 (p75 vs.C257A/G266I); **, p < 0.001 (p75 vs. Δ193/C257A/G266I). (B) Fluorescence images of MDCK cells stably expressing p75, C257A/G266I, Δ193, and Δ193/C257A/G266I mutants. Apical, lateral, and xz images from a confocal stack are shown. Scale bar: 10 μm. (C) Domain-selective biotinylation of radiolabeled p75, C257A/G266I, Δ193, and Δ193/C257A/G266I mutants. A representative gel is shown. Ap, apical; Bl, basolateral; Total, one-fifth of total labeled protein. (D) Quantitation of three to five experiments, each performed in duplicate, is plotted as the percent of total labeled protein biotinylated at the apical surface. Unpaired t test: ***, p < 0.001; **, p < 0.01; *, p < 0.05.

