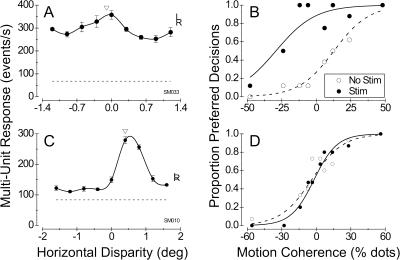
Figure 2. Effect of Microstimulation on Direction Judgments at Two Illustrative Stimulation Sites from Monkey S.
A site with weak disparity tuning (DTI = 0.37) is shown in (A) and (B) and a site with strong disparity tuning (DTI = 0.87) is shown in (C) and (D).
(A) Disparity tuning of MU activity at a stimulation site with weak disparity selectivity. Filled circles show the mean response to four stimulus presentations at each disparity, with error bars indicating ±1 SE. The solid curve is a cubic spline interpolation. The letters “L” and “R” are plotted at the response levels obtained when the same stimulus is shown only to the left and right eyes, respectively. The dashed horizontal line gives the spontaneous activity level in the absence of any visual stimulus, and the arrowhead denotes the disparity chosen for the direction discrimination task.
(B) Effect of microstimulation on direction judgments for the site with the disparity tuning indicated in (A). The proportion of decisions made by the monkey toward the neurons' preferred direction of motion is plotted against the motion coherence of the random-dot stimulus. Open circles show the behavior obtained in the absence of microstimulation; the dashed curve is the best fit to these data using logistic regression. Filled circles and the solid curve show data from randomly interleaved trials in which microstimulation was applied. Note the large leftward shift of the psychometric function, equivalent to 38.7% dots (logistic regression, p < 0.001).
(C) Disparity tuning of MU activity at a stimulation site with strong disparity selectivity. Again, the arrowhead denotes the disparity at which dots were presented in the direction discrimination task.
(D) Effect of microstimulation on direction judgments for the site with the disparity tuning indicated in (C). In this case, there was no significant shift of the psychometric function when microstimulation was applied (p > 0.5); the small difference in slope between stimulated and nonstimulated trials is also not significant (p > 0.25).

