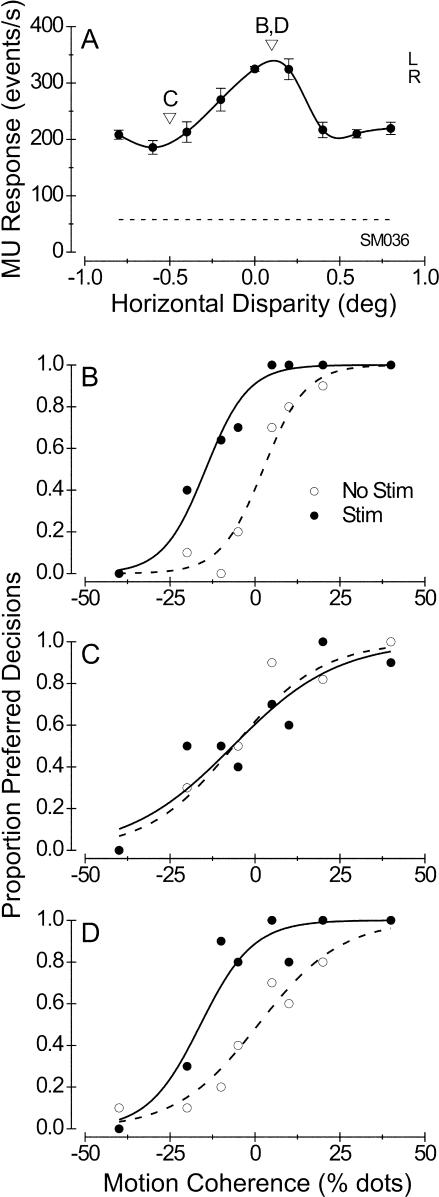
Figure 6. Example of a Disparity-Selective Microstimulation Effect.
(A) Disparity tuning of MU activity at this stimulation site. Conventions as in Figure 2A. Arrowheads and letters indicate the disparity values used to perform the microstimulation experiments illustrated in (B), (C), and (D). DTI = 0.55.
(B) First block of direction discrimination trials, in which dots were presented at the preferred disparity (0.1°). The stimulation psychometric function (filled symbols, solid curve) is shifted well to the left of the nonstimulation function (open symbols, dashed curve) by an amount equivalent to 17% dots (logistic regression, p < 0.001), with no corresponding change in the slope of the curve (p > 0.9).
(C) Second block of discrimination trials, in which dots were presented at a nonpreferred disparity (-0.5°). In this case, the two psychometric functions did not differ significantly in horizontal position (p > 0.8) or in slope (p > 0.5).
(D) Third block of discrimination trials, with dots again presented at the preferred disparity (repeat of [B]). Again, microstimulation produced a leftward shift equivalent to 17% dots (p < 0.001). The small increase in the slope of the stimulation psychometric function is not significant (p > 0.2).

