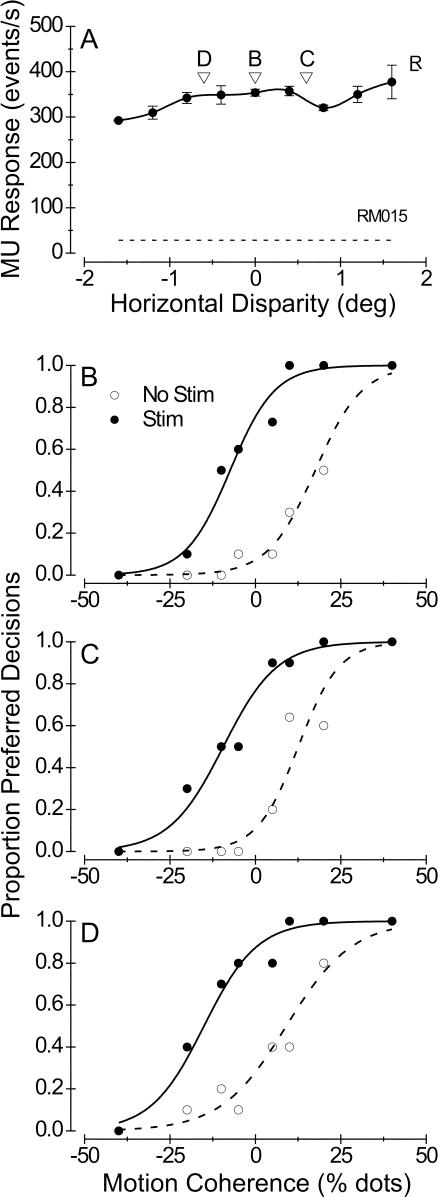
Figure 7. Example of a Nondisparity-Selective Effect of Microstimulation at a Site with Poor Disparity Tuning.
(A) MU disparity-tuning curve; DTI = 0.27. (B–D) Effects of microstimulation on direction discrimination when dots were presented at disparities of 0°, 0.6°, and −0.6°, respectively. In each case, the leftward shift of the psychometric function is highly significant (logistic regression, p < 0.0001) while the slopes were unchanged (p > 0.4).

