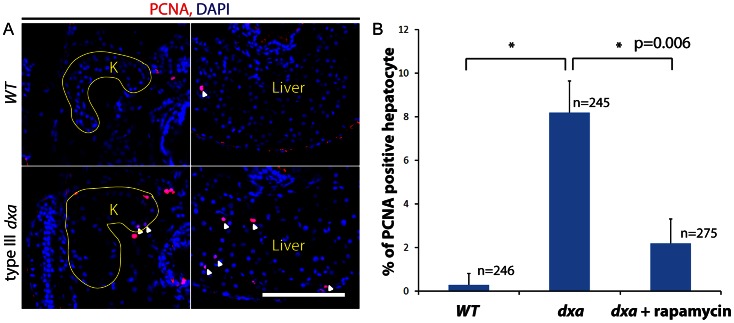
Figure 7. Increased proliferation in dxavu463 mutant kidney and liver.
(A) PCNA staining in the kidney and liver of wild type (top) and type III dxa mutant (bottom). Yellow lines indicate kidneys. DAPI (blue) was used for nuclei staining. (B) PCNA positive cells were counted from three different WT, dxa mutant and rapamycin treated dxa mutant liver section. N = 246 (WT), 245 (dxa), 275 (dxa + rapamycin) cells. *p = 0.006 for both comparisons.

