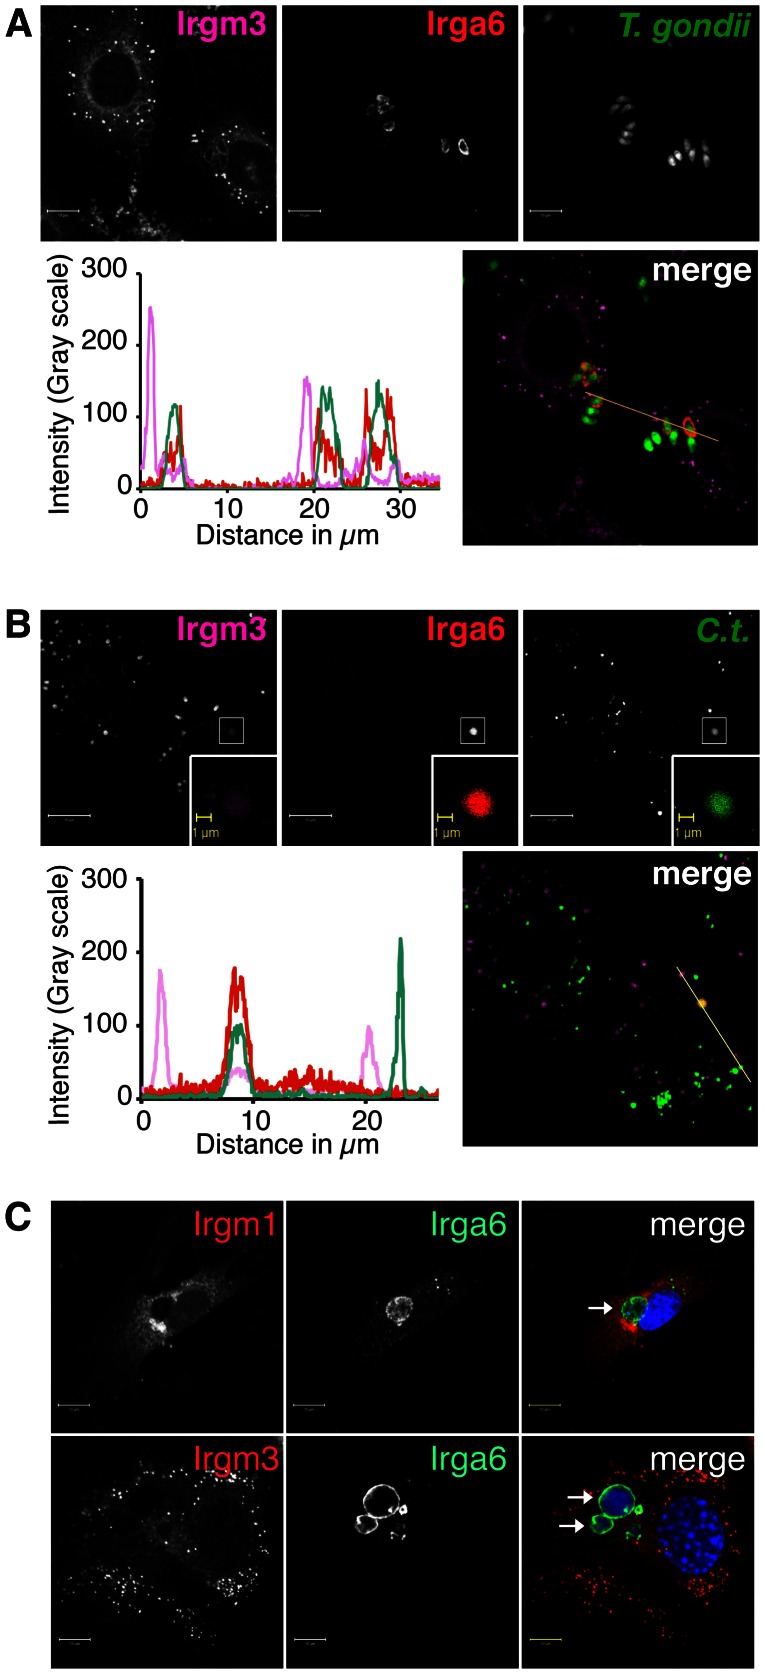
Figure 4. T. gondii PVs and C. trachomatis inclusions are largely devoid of Irgm1/m3.
Images and line tracing of fluorescent intensity are shown. Data are representative of results obtained in at least 3 independent experiments conducted for each experimental design. (A). IFNγ-activated MEFs were infected with GFP-expressing T. gondii and stained with an anti-Irga6 and anti-Irgm3 antibody. (B) IFNγ-activated MEFs were infected with GFP-expressing C. trachomatis and stained with an anti-Irga6 and anti-Irgm3 antibody at 2 hpi. (C) MEFs were infected with C. trachomatis and activated with 100 U/ml of IFNγ at 3 hpi. Cells were fixed at 20 hpi and stained with an anti-Irga6 antibody in combinations with either anti-Irgm1 or anti-Irgm3 antibodies and Hoechst. Whereas Irga6 co-localized with inclusions at the expected frequency of 10–15% (data not shown), no targeting of endogenous Irgm1 or Irgm3 to inclusions was observed in the course of examining the staining of more than one hundred randomly selected inclusions. Arrows point at inclusions.

