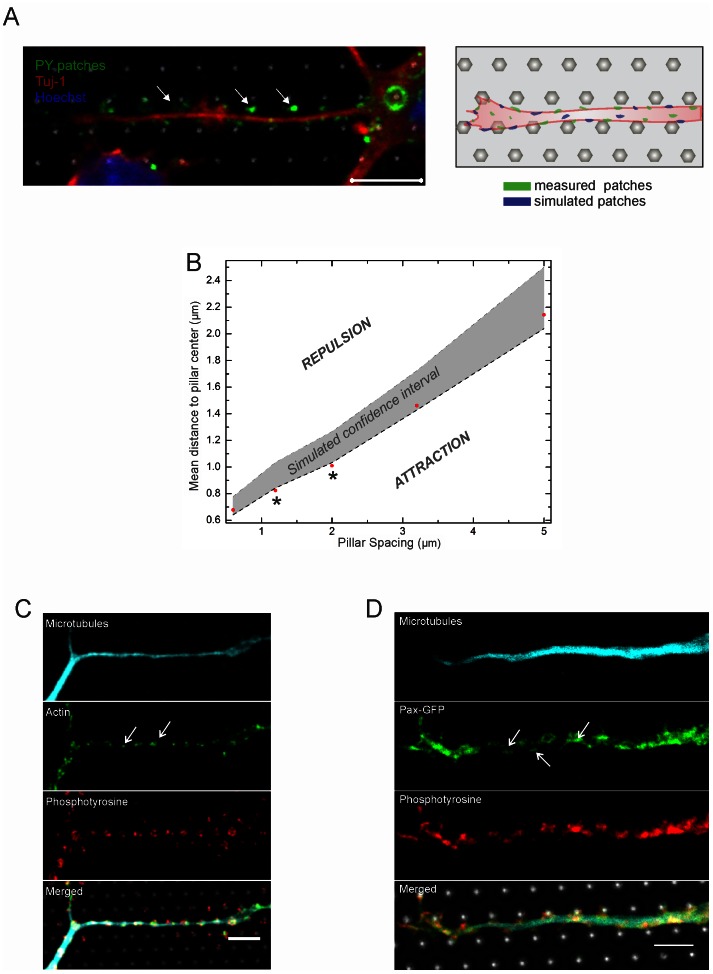
Figure 7. Signaling events at pillar contacts.
(A) Example of a hippocampal neuron grown on a pillar substrate (W = 1.6 µm, S = 1.2 µm) stained for phosphotyrosine (PY, green) and tuj-1 (red). Scale bar is 5 µm. (B) Comparison of the mean patch distance from the pillar center (red marks) to the confidence interval for the simulated patches (gray shaded area). For a constant W = 1.6 µm, the PY patches are outside of the confidence interval for S = 1.2 µm and S = 2 µm. This is indicated by a *. See Table 1 for detailed parameter values. Individual cases are tabulated in Table S1. The y-axis values were drawn as shown in a representative example in Fig. S3B. (C) Co-localization of actin filaments and phosphorylated tyrosine positions. Cyan βIII-tubulin, green actin, red phosphotyrosine. (D) Paxillin-GFP shows the same expression pattern than phosphotyrosine. Cyan βIII-tubulin, green Pax-GFP, red PY. Scale bars are 5 µm.

