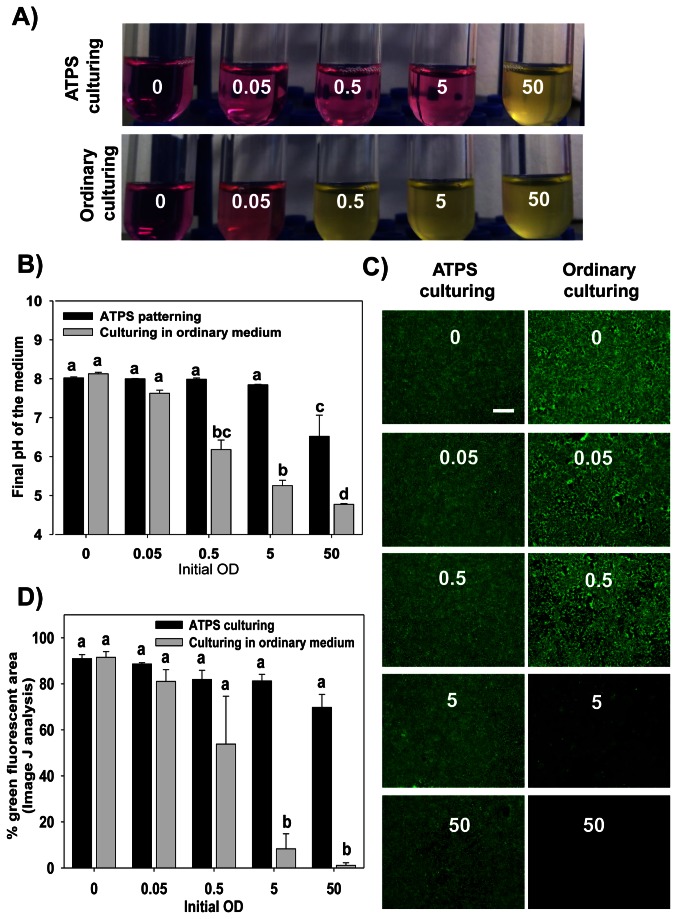
Figure 2. Comparing ATPS culturing with the ordinary culturing of bacteria on MCF 10a layer substrate.
E. coli MG1655 was spotted on an MCF 10a monolayer at different rOD values using both ordinary culturing and ATPS technique. For the former, the bacteria were re-suspended into ordinary DMEM/F12 medium at the required rOD and then spotted directly as single 0.3 µl droplet into 2.5 ml of the medium. For the ATPS patterning, the bacteria were re-suspended in DEX rich DMEM/F12 medium and one 0.3 µl droplet was spotted in 2.5 ml of PEG rich medium of the first ATPS formulation. All plates were then incubated at 37°C for 24 h before being analyzed. A) The change in the color of the medium (with phenol red indicator) 24 h after spotting different doses of E. coli inside 35 mm Petri dishes. The medium was aspirated from the dishes in 10 ml glass tubes as shown. B) The average pH values for the media shown in panel A with the error bars representing the standard errors of 3 replicates for each case. Statistical analysis was performed using ANOVA followed by Tukey post hoc test (a, b, c and d = p < 0.05). C) Representative photos for the MCF 10a sheet in the Petri dishes after 24 h of incubation with the bacteria for both types of culturing. The medium was aspirated, and the plates were washed well to remove the attached bacteria. Afterwards, the epithelial cell sheet was stained with Calcein AM dye and observed using an epiflourescence microscope. Scale bar: 500 µm. D) Plot showing ImageJ analysis for epithelial areas fluorescing green in the photos shown in panel (C). The error bars represent the standard errors of three images for each case (a, and b = p < 0.05).

