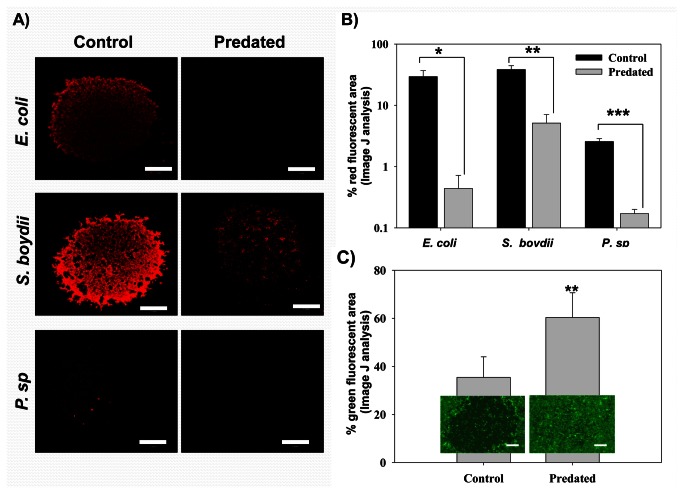
Figure 5. B . bacteriovorus predation of E. coli, S. boydii, and P. sp communities on MCF 10a monolayer.
The three preys; E. coli MG1655, S. boydii KACC 10792, and P. sp DSM 50906 were suspended in the DEX rich phase and spotted as separate drops in the same plate at an initial rOD of 0.5. For the predator plates, B . bacteriovorus HD 100 was added to the PEG phase as described in the Materials and Methods section. The control plates were filled with only the PEG rich phase, i.e., without the predator added. Both sets of plates were incubated for 24 h then observed microscopically. A) The confocal microscopy photos for the three preys communities in both the control plate and the predated ( B . bacteriovorus HD 100 containing) one. All images in panels A were taken using the same microscopy settings so that the data for the three organisms could be compared. Scale bar: 1mm. B) ImageJ analysis for the images in panel (A) showing the percent area of the image fluorescing red. The error bars show the standard error obtained from the analysis of at least 3 images for each case. Statistical analysis was performed using t-test. * p < 0.05, ** p < 0.01, *** p < 0.001. C) B . bacteriovorus predation protected MCF 10a against the effects of P. sp DSM 50906. P. sp was spotted at a rOD of 5. After incubating the plates for 24 h at 37°C, the epithelial cells were stained and observed using an epifluorescence microscope. The plot compares the green fluorescence of the epithelial areas underneath the P. sp spots for both the control and predated plates. The error bars represent the standard error of six replicates for each case. ** p < 0.01. The images are representative photos showing the appearance of the two areas as observed using epiflourescence microscope. Scale bar: 500µm.

