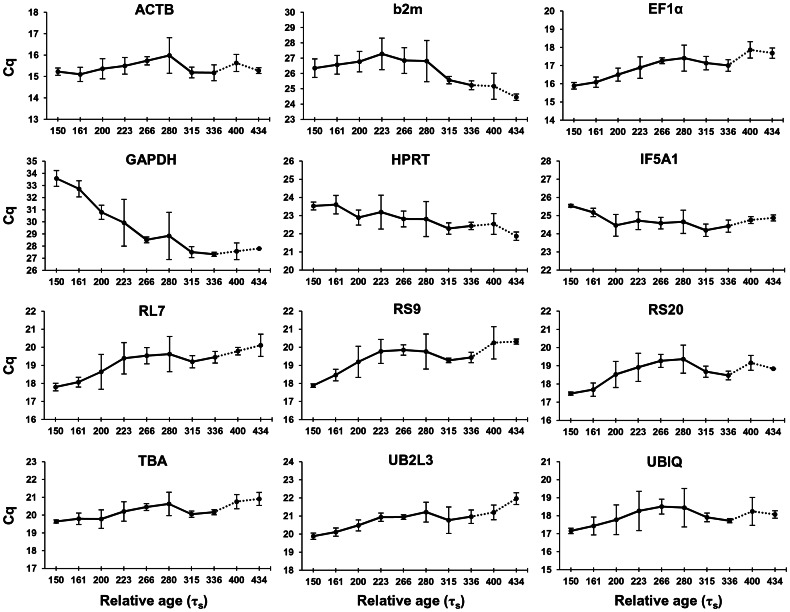
Figure 2. Expression levels of reference genes in the head of four charr groups during development.
Expression profiles of 12 candidate reference genes based on quantitative real time PCR performed on embryonic heads from four charr groups at the relative ages 150 to 434 τs. Expression levels are shown as mean Cq (quantification cycle) values in the four charr groups at corresponding relative age, except for the two last time points (dashed line), which are based on samples of only two groups(AC and PL charr). Error bars represent standard deviation.

