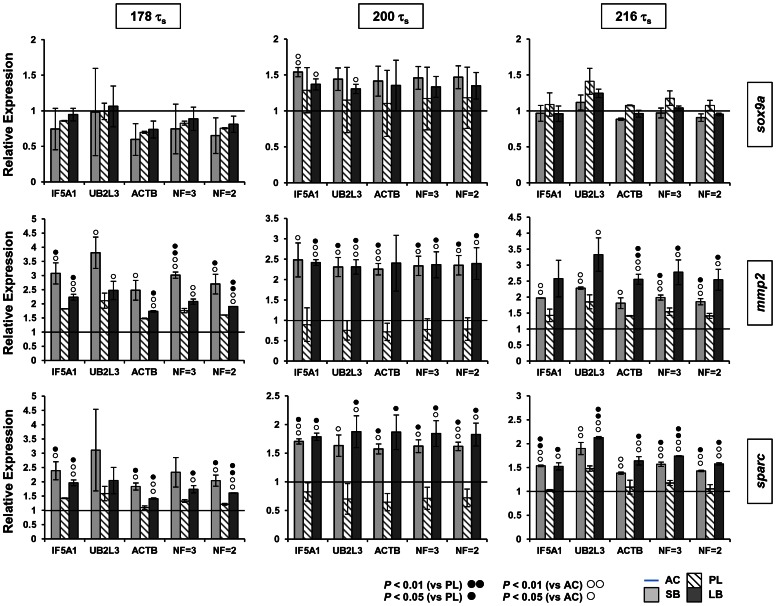
Figure 5. Comparison of different reference genes for normalising the expression of sox9a, mmp2 and sparc in charr heads at three embryonic stages.
Expression of sox9a, mmp2 and sparc was examined with qPCR and normalised using either individual or two combinations of reference genes. Normalisation factors (NF) were based on geometric means of either two or three genes (NF = 2: ACTB and IF5A1; NF = 3: ACTB, IF5A1 and UB2L3). In each analysis (panel column) relative expression levels of the three genes in small benthivorous (SB), planktivorous (PL) and large benthivorous charr (LB), are compared to expression levels in aquaculture (AC) charr (horizontal line) at the same embryonic stage. Statistical differences of SB or LB gene expression versus expression in either PL (black circles) or AC (white circles) are indicated. Error bars represent standard deviation calculated from two biological replicates. Each biological replicate contains homogenate of six heads.

